
TL;DR
Prediction market technical analysis can show how traders are repricing an outcome, where participation increased, which probability levels attracted repeated trading, and whether a move held. It cannot tell you whether the contract will resolve YES. Use the chart to study behavior, then check the latest facts, exact resolution language, executable spread, and available depth before acting.
- Treat price as the market's current estimate, not objective truth.
- Read a move alongside volume and the bid-ask spread.
- Expect fresh evidence to break chart levels without warning.
- Record what would invalidate the trade before entering.
Platform documentation and the data exercise were checked as of 8:16 a.m. ET on September 7, 2026. Market prices and order books can change at any time. This guide is educational and is not financial advice.
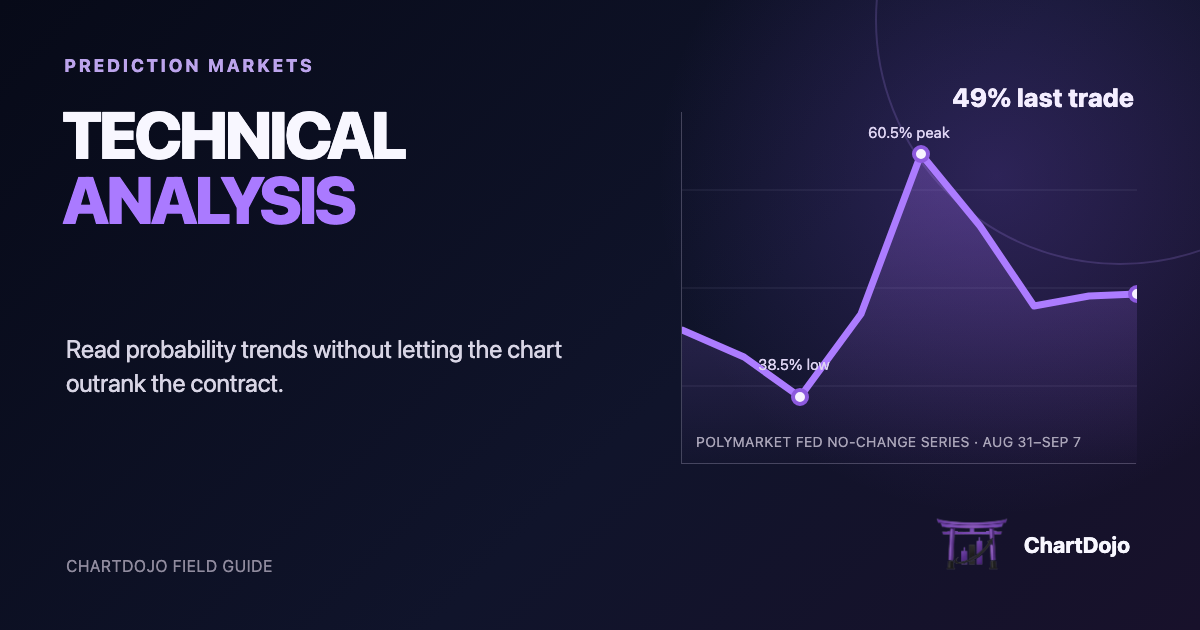
Feature graphic: Original ChartDojo chart using the sourced Polymarket series examined below.
What is prediction market technical analysis?
Prediction market technical analysis studies historical contract-price patterns and order-book behavior. A binary YES contract usually trades between $0 and $1, so a price near $0.55 is often read as a market-implied probability near 55%. The CFTC describes many event contracts as fixed-payout yes-or-no products whose prices reflect traders' expectations.
The important word is market-implied. A 55-cent price records what participants were willing to trade around. It does not prove the event has a 55% true probability. Polymarket also says its displayed probability may be the midpoint between the best bid and ask. That midpoint may differ from the price available to a buyer or seller.
How probability chart analysis works
Start with trend and range. A sequence of higher swing lows can show that buyers are accepting larger implied probabilities. Repeated reversals near one level can identify a zone where orders previously balanced. Traders often call the lower zone support and the upper zone resistance.
Those labels describe past behavior. They are not walls. An official decision, court filing, injury report, or data release can reset the fair probability in seconds. In an event contract, the source and timing of new information usually matter more than a line drawn through old prices.
Volume helps distinguish a quiet drift from a move with wider participation. Order-book depth adds another layer. A one-cent spread with large size near the top of the book is different from a chart printed by small trades in a thin market. Historical candles are useful, but the current bid and ask determine what can be traded now.
Worked Polymarket probability-chart exercise
ChartDojo pulled Polymarket's public hourly price history for the YES token in its September 2026 Federal Reserve no-change contract. The contract resolves against the Federal Open Market Committee statement and defines the outcome by the upper bound of the target federal funds range. The sample contained 169 observations from August 31 through September 7.
| Checkpoint | Historical price | What the chart reader can say |
|---|---|---|
| Aug. 31, 9:00 a.m. ET | 45.5% | The sample opened below an even-money estimate. |
| Sep. 2, 2:00 a.m. ET | 38.5% | This was the lowest sampled hourly value. |
| Sep. 3, 10:00 a.m. ET | 60.5% | The series reached its sampled high after a sharp repricing. |
| Sep. 7, 8:12 a.m. ET | 50.5% | Much of the move had retraced into a balanced area. |
The chart identifies a 22-point span between the sampled low and high. It does not identify the cause by itself. A disciplined review would place official Fed communications and economic releases on the same timeline before attributing any move.
The live order book made a second point. At 8:16 a.m. ET, the best YES bid was $0.50, the best ask was $0.51, the last trade was $0.49, and the price-history endpoint showed 50.5%. All four numbers can be accurate because they describe different parts of the market. A buyer crossing the spread would face the ask, not the historical chart's latest plotted value.
A four-step chart-reading checklist
- Read the contract wording and identify the official resolution source.
- Mark the sampled range and any levels that attracted repeated trading.
- Overlay timestamped news or primary documents instead of guessing why price moved.
- Check the current bid, ask, visible size, and fee before planning an entry.
Potential positives vs negatives
Potential positives: A probability chart compresses many trades into a readable history. It can reveal when an estimate changed quickly, whether price held after the first reaction, where participants repeatedly disagreed, and how much of a move later retraced. Candlestick data also supports consistent replay exercises across different event types.
Potential negatives: Thin trading can make a line look more authoritative than it is. A midpoint can hide a wide spread, while one small fill can print away from the book. The largest weakness is event risk: decisive new facts can make prior support or resistance irrelevant.
What could happen from here
When the method is useful: Technical analysis becomes more informative when a contract trades regularly, the spread stays narrow, volume confirms the move, and repeated reactions occur without a change in the governing facts. That condition weakens if volume dries up or the top of book cannot support the intended size.
When facts take control: A scheduled release or official announcement can cause an immediate probability reset. The chart remains useful for reviewing the reaction, but it should not be used to resist verified information. A move that holds after traders have time to read the source carries more information than the first print.
When the setup should be rejected: Walk away when the contract language is ambiguous, the resolution source is unclear, or the spread makes the apparent edge uneconomic. A clean-looking pattern cannot repair a contract that the trader does not understand.
What traders should watch next
- Whether the plotted series uses trades, midpoints, or another price convention.
- The current spread and depth at the intended order size.
- Scheduled releases and official sources tied to resolution.
- Any rule update that changes the deadline or qualifying outcome.
Newer readers can start with the prediction-market trading workflow. If the same event appears on more than one venue, use the prediction-market arbitrage checklist before comparing charts. The Kalshi versus Polymarket guide explains why platform structure also matters.
FAQ
Do prediction market prices equal true probabilities?
No. A contract price is a market-implied estimate shaped by available information, liquidity, fees, participant beliefs, and the orders in the book. It can be useful without being perfectly calibrated.
Can support and resistance work in prediction markets?
They can describe zones where trading previously changed direction. They do not override new facts or settlement rules, and they may be weak in a thin market.
Should traders use volume with a probability chart?
Yes. Volume shows how much trading accompanied a move. Pair it with spread and depth because a large cumulative volume figure does not guarantee good execution at the current price.
Where can traders get historical prediction-market data?
Polymarket documents a public price-history endpoint. Kalshi documents both intraday and daily candlestick intervals for its markets. Review each platform's current API terms and field definitions before using the data.
Sources
- CFTC: Understanding prediction markets and event contracts
- Polymarket: Prices and order book
- Polymarket API: Get prices history
- Polymarket: September 2026 Fed decision market
- Kalshi API: Get market candlesticks
Build real skills, not bad habits. ChartDojo lets traders practice chart decisions and get AI-powered feedback before real capital is at risk. Start a free trial.