
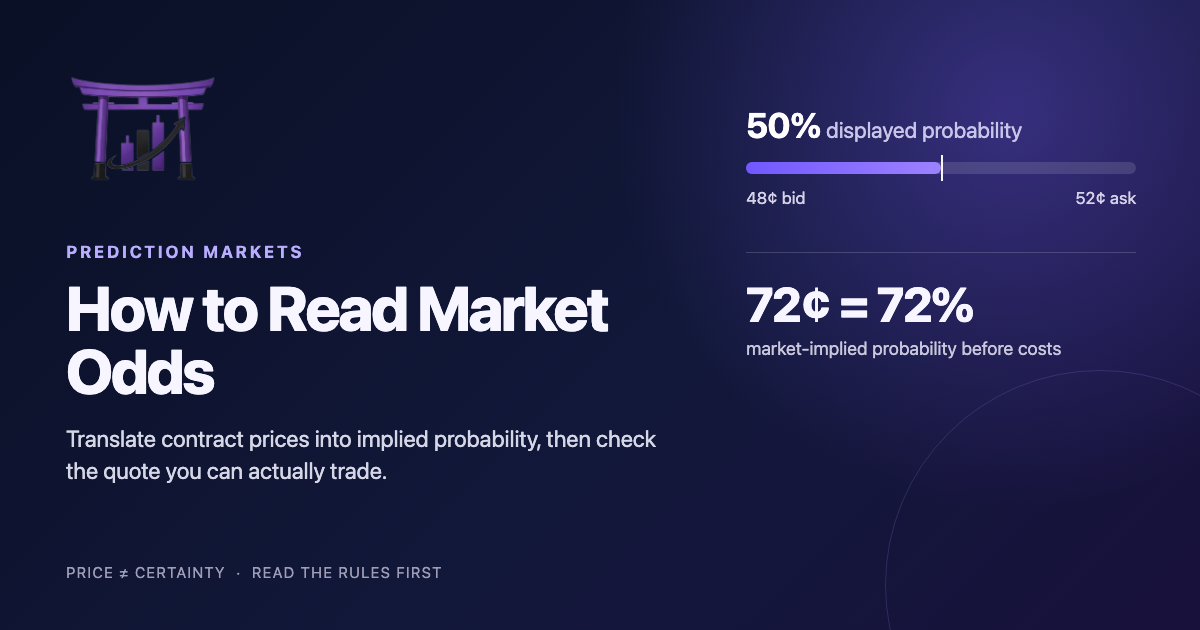
To read prediction market odds, treat a 72-cent Yes contract as a 72% market-implied probability before fees and execution costs. Then check the bid, ask, contract rules, and settlement source. The displayed percentage is a tradable market signal, not a statement of certainty or proof that the crowd is correct.
Platform pricing documentation was checked at 12:50 a.m. ET on September 15, 2026. The prices below are hypothetical educational examples, not live market quotes or financial advice.
TL;DR
- For a standard $1 binary contract, price in cents converts directly to market-implied probability. A 64-cent Yes price implies 64%.
- Use the price available for your order. A displayed midpoint can differ from the ask a buyer must pay or the bid a seller can receive.
- Subtract fees, spread, and slippage from any perceived advantage before deciding whether the trade is worth taking.
- Read the resolution rules first. The probability applies to the event as the contract defines it.
How to read prediction market odds
Most binary prediction-market contracts resolve to $1 for the winning side and $0 for the losing side. That payoff creates a simple conversion:
Market-implied probability = contract price in cents
A Yes contract offered at 38 cents implies a 38% market probability. Its paired No side corresponds to 62% when the two prices are complementary. If Yes wins, a 38-cent purchase held through settlement produces 62 cents of gross profit per contract before costs. If Yes loses, the 38-cent stake is lost.
The Commodity Futures Trading Commission's event-contract guide describes this fixed-payout structure and says a contract price reflects traders' perceived probability. The word perceived matters. Price aggregates orders from participants with different information, incentives, time horizons, and risk limits.
A trader should read 38 cents as "the market is pricing about 38%, under this venue's display convention." It does not mean the event has an objective 38% chance or that the market cannot be wrong.
How the pricing mechanism works
Prediction markets use order books. Buyers submit bids, sellers submit offers, and trades occur when compatible orders meet. Kalshi's pricing explanation says prices move with supply and demand as opposing orders are matched. A Yes and No pair is backed by a combined $1.
Three numbers can appear around the same market:
- The bid is the highest price a buyer currently offers.
- The ask is the lowest price a seller currently accepts.
- The midpoint is halfway between the best bid and ask.
Suppose the best Yes bid is 48 cents and the best ask is 52 cents. The midpoint is 50 cents, so a venue may display 50%. A market order to buy would generally face the 52-cent ask. A sale would generally face the 48-cent bid. The four-cent gap is the bid-ask spread.
Polymarket's current price-display documentation says it normally shows the midpoint of the order-book spread. When the spread exceeds 10 cents, it shows the last traded price instead. This is why the large percentage on a market page may be a reference value rather than the price available for the desired quantity.
Depth also matters. Buying more contracts can consume several offers and raise the average fill price. ChartDojo's prediction market liquidity guide explains how spreads, depth, and partial fills change the economic entry.
A probability conversion and mispricing worksheet
This worksheet separates the displayed probability from the decision price. It also forces the trader to document a personal estimate before seeing whether an apparent edge survives costs.
Step 1: translate the quote
Use the executable ask for a purchase. In the 48-cent bid and 52-cent ask example, the initial Yes hurdle is 52%, not the displayed 50% midpoint.
Step 2: add trading costs
Assume fees and expected slippage add 1.5 cents per contract. The all-in break-even probability becomes 53.5% for a position held to settlement. Venue schedules vary, so use the current order preview and the method in ChartDojo's prediction market fees guide.
Step 3: record an independent estimate
Suppose a documented forecast process produces a 58% probability. The estimated edge is:
Estimated edge = 58% - 53.5% = 4.5 percentage points
That is a model estimate, not an expected guarantee. Forecast error, changing information, contract interpretation, and exit costs can erase the difference.
Step 4: stress-test the estimate
Recalculate at 54%, 58%, and 62%. At 54%, the edge is only 0.5 points. At 58%, it is 4.5 points. At 62%, it is 8.5 points. If a small, reasonable change in the estimate removes the edge, passing may be the disciplined choice.
For multi-outcome markets, repeat the process for each outcome. Displayed percentages may fail to total exactly 100 because of spreads, last-trade conventions, fees, or thin liquidity. Compare executable prices rather than adding headline percentages alone.
Potential positives vs negatives
Potential positives
- The cents-to-percent conversion makes the market's current view easy to interpret.
- Order books reveal how much interest exists at nearby prices.
- A written probability estimate gives the trader a clear benchmark for post-settlement review.
- Limit orders can define an acceptable entry price, although they may remain unfilled.
Potential negatives
- A midpoint can overstate the price at which a large order can execute.
- Thin markets may show stale trades or wide spreads.
- Fees and slippage raise the probability needed to break even.
- Ambiguous wording can make a correct forecast irrelevant to settlement.
What could happen from here
Efficient-price scenario
New orders cluster near the current range, the spread stays narrow, and the displayed probability remains close to executable prices. Stable depth confirms this scenario. A sudden spread increase or a large information shock weakens it.
Information-update scenario
A credible release changes the probability estimate and traders rapidly reprice the book. Multiple fresh trades with deeper volume support the move. A reversal after weak sourcing or low volume would challenge it.
Liquidity-distortion scenario
The headline percentage moves because one side of a thin order book disappears. The change may exaggerate the information update. Wide spreads and shallow depth confirm this risk. New two-sided orders near the prior range reduce it.
What traders should watch next
- Copy the full contract question, cutoff time, and resolution source.
- Record the displayed probability, best bid, best ask, and available depth.
- Convert the executable quote into a probability hurdle.
- Add fees and expected slippage in cents per contract.
- Write an independent probability estimate and its evidence.
- Stress-test the estimate, then define the price that cancels the trade.
After settlement, compare the original estimate with the result and the evidence available at entry. ChartDojo's prediction-market trading workflow provides a broader contract-to-review process.
FAQ
Does a 70-cent Yes contract mean the event will happen?
No. It means the market is pricing the contract at roughly a 70% implied probability under the venue's display method. The event can still fail, and the price can be distorted by limited liquidity or incomplete information.
Should Yes and No prices add to $1?
A matched binary pair is backed by $1, but the best available Yes and No asks can total more than $1 because each includes a spread. Headline display values may also use midpoints or last trades.
Is the displayed probability the price a buyer pays?
Not always. The displayed figure may be a midpoint or last traded price. Check the current ask and order-book depth for the quantity you want.
How can a trader decide whether odds are mispriced?
Build a documented probability estimate, compare it with the all-in break-even probability, and test how sensitive the difference is to forecast error. A gap is an estimate of possible edge, not proof of profit.
Sources
- CFTC: Understanding Prediction Markets and Event Contracts
- Kalshi Help Center: How Are Prices Determined?
- Kalshi Help Center: What Are Prediction Markets?
- Polymarket: How Are Prices Calculated?
Practice turning quotes into probability decisions before real money is at risk. Start a free ChartDojo trial for AI-powered feedback on your process. Build real skills, not bad habits.