
Prediction market calibration measures whether events assigned a given probability occur about that often across many forecasts. If your 70% calls resolve Yes roughly seven times in ten over a sufficiently large, comparable sample, that bucket is well calibrated. Use probability buckets alongside a Brier score, then compare your record with a benchmark before considering more capital.
By Ulysses Cornelius. Educational analysis, not financial advice. Method and sources checked September 18, 2026, at 8:13 a.m. ET. All numerical examples below are hypothetical, not live market odds or ChartDojo user results.
TL;DR
- Save each probability before the outcome is known. Keep the exact contract rules with the forecast.
- Score forecast error and inspect probability buckets separately. A lower Brier score alone does not establish better calibration.
- Use the 50-forecast exercise below as a starting diagnostic. Small or correlated samples cannot establish a durable trading advantage.
- Compare forecasts at the same time horizon, then evaluate trading costs separately.
What does prediction market calibration measure?
A binary event contract has two possible outcomes under its settlement rules. The CFTC's event-contract explainer describes a common structure with a fixed payout, usually $1. For this exercise, record Yes as 1 and No as 0. Exclude partial-payout contracts unless you define a different scoring method in advance.
Calibration concerns repeated forecasts. A single 90% prediction that fails is compatible with a calibrated process. Repeated 90% forecasts that succeed only 60% of the time suggest excessive confidence, subject to sample size and the events' dependence.
Market price and your probability estimate are different inputs. Our guide to reading prediction market odds explains that distinction. Save both without rewriting your original estimate after settlement.
How Brier scores and probability buckets work
The binary Brier score is the average squared distance between a probability and its outcome. Use probabilities from 0 to 1. Under this convention, the score ranges from 0 to 1, and lower is better.
Brier score = sum((p - y)^2) / N
Here, p is the saved Yes probability and y is the final outcome. N is the number of scored forecasts. A 70% forecast earns 0.09 when Yes wins: (0.70 - 1)². If No wins, the score is 0.49: (0.70 - 0)².
Do not read that score as a pure calibration measure. The scikit-learn calibration guide explains that Brier loss also reflects discrimination and outcome uncertainty. Discrimination means separating events more likely to occur from those less likely to occur.
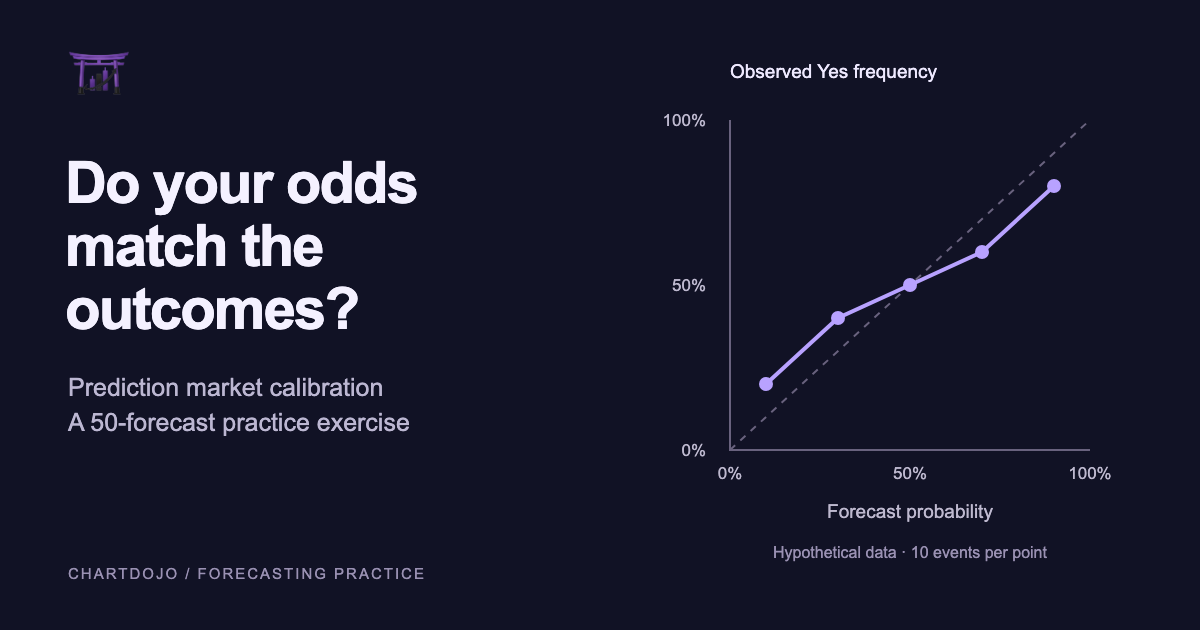
A reliability diagram addresses calibration more directly. Group forecasts into probability buckets. Plot each bucket's average predicted probability against its observed Yes frequency. Show the count in every bucket; a dot from ten events has much less evidential weight than one from hundreds of comparable independent events.
A 50-forecast calibration exercise and scoring template
Choose a defined event category and one forecast horizon, such as 24 hours before the scheduled decision. Save one forecast per event at that horizon. Keep later revisions in a separate evaluation so frequently updated contracts do not dominate the sample.
- Create columns A through D for event ID, contract URL, rule snapshot, and forecast timestamp.
- Use E for your Yes probability and F for a contemporaneous market reference probability. Record its source and timestamp in G. A midpoint is a research reference, not an executable fill.
- After final settlement, enter 1 or 0 in H. Put
=(E2-H2)^2in I and=(F2-H2)^2in J, then copy down. Leave unsettled rows unscored. - When rows 2 through 51 contain 50 resolved forecasts, calculate
=AVERAGE(I2:I51)and=AVERAGE(J2:J51). Compare the same events and horizons. Set any void or disputed-contract treatment before seeing results, and report exclusions.
The following constructed sample has ten forecasts at each displayed probability. It illustrates the arithmetic; it is not evidence about any exchange or trader.
| Forecast probability | Events | Yes outcomes | Observed Yes frequency | Mean Brier score |
|---|---|---|---|---|
| 10% | 10 | 2 | 20% | 0.170 |
| 30% | 10 | 4 | 40% | 0.250 |
| 50% | 10 | 5 | 50% | 0.250 |
| 70% | 10 | 6 | 60% | 0.250 |
| 90% | 10 | 8 | 80% | 0.170 |
For the 70% group, six Yes outcomes contribute 6 × 0.09 and four No outcomes contribute 4 × 0.49. Dividing their sum by ten gives 0.250. Averaging all 50 squared errors gives 0.218. A constant 50% forecast would score 0.250 on this same sample.
Despite beating that simple benchmark, four buckets miss their observed frequency by ten percentage points. The extreme forecasts lean too far from 50% in this sample. That is a reason to collect more comparable observations, not a mechanical instruction to adjust every future forecast by ten points.
For real forecasts with varying probabilities, choose bucket boundaries before scoring and report the actual mean probability within each bucket. Do not substitute the bucket midpoint. Keep related contracts from the same event identified: ten thresholds on one announcement are not ten independent trials.
Potential positives vs negatives
Calibration review exposes whether confidence levels match outcomes. It also gives new traders a repeatable practice task that requires no funded position.
The main risk is false confidence from a neat table. Fifty forecasts are only a starting batch, and ten observations per bucket are noisy. Changing the event mix can change a Brier score without improving the forecasting process. A favorable score also says nothing about whether available prices covered fees.
What could happen from here
Base scenario: the next sample remains inconclusive
Bucket frequencies move around and benchmark differences shrink. Continue paper evaluation under the same rules. Evidence of a persistent gap across fresh batches would challenge the view that the first result was mostly sampling noise.
Upside scenario: a repeatable forecasting improvement
Fresh, comparable events show smaller calibration gaps while forecast scores improve against the saved market reference. Check that one event cluster did not drive the result. Even then, evaluate entry costs before making a trading decision.
Downside scenario: confident errors persist
High-probability forecasts keep failing more often than expected across new batches. Review source quality and reduce reliance on that estimation method. A correction learned from past results needs evaluation on later outcomes before it can be considered useful.
What traders should watch next
Track the number of resolved independent events and any change in the forecast horizon. Record revised settlement rules before adding affected contracts to the comparison. Recheck whether your research price was available at the saved timestamp.
Keep scoring separate from prediction market position sizing. For an illustrative $1 Yes contract held to settlement, a true 60% win probability and a 62-cent total entry cost imply an expected loss of two cents per contract, even before other costs. Good probability assessment cannot repair an unfavorable purchase price.
FAQ
What is a good Brier score?
There is no universal trading threshold. Compare the same events against a declared benchmark at the same horizon, using the same score convention. Easier event sets can produce lower scores without demonstrating better skill.
Are 50 forecasts enough to prove calibration?
No. They can expose recordkeeping problems or suggest patterns worth examining. Evidence depends on the number of observations within each bucket and how independent the events are.
Does ChartDojo automatically score event contracts?
This worksheet is a separate spreadsheet exercise. It does not claim a live prediction-market integration or automatic Brier scoring in ChartDojo.
Sources
- CFTC, Understanding Prediction Markets and Event Contracts, for the contract structure.
- Scikit-learn, Brier score loss documentation, for the binary scoring formula and scale.
- Scikit-learn, Probability calibration documentation, for reliability diagrams and the limits of Brier loss as a calibration measure.
Cover: original ChartDojo reliability diagram calculated from the hypothetical 50-forecast table above. The diagonal marks exact agreement; plotted observations are illustrative.
Build real skills, not bad habits. Practice trading decisions with ChartDojo and use AI-powered feedback to examine your process. Start your free trial.