
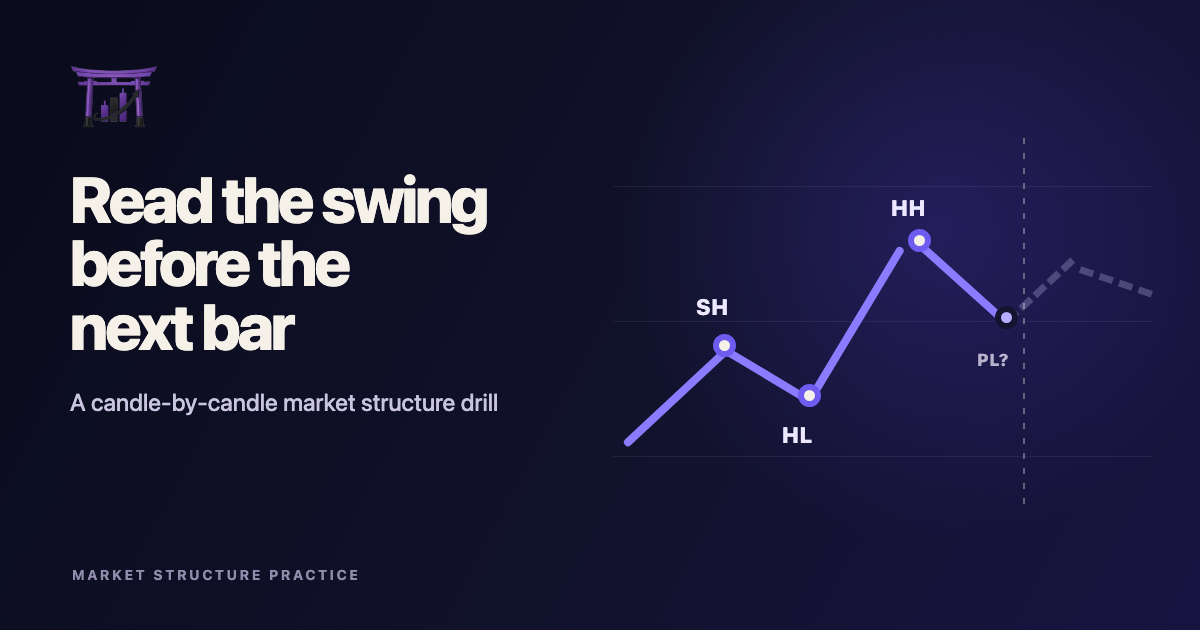
To practice market structure with Bar Replay, you need more than a clean chart and a play button. The useful skill is deciding what the visible swings mean before the next candle appears. If you label every move after it is complete, the chart will look easier than it felt in real time.
This guide turns market structure practice into a candle-by-candle drill. You will mark provisional swing points, state what would invalidate your current read, and score whether your labels stayed consistent as new bars arrived. The score is about decision quality. It is not a claim that a pattern predicts profit or that simulated results will carry over to live trading.
TL;DR
- Hide future candles and use one fixed timeframe for the whole practice session.
- Label each possible swing as provisional until later price action confirms it.
- Write an invalidation condition before revealing the next bar.
- Score consistency separately from whether price moved in the direction you expected.
- Review label changes after the session instead of rewriting the chart while it unfolds.
How to practice market structure with Bar Replay
Market structure is a description of how visible swing highs and swing lows relate to one another. An uptrend is commonly described through rising swing points. A downtrend uses falling swing points. A range has repeated rejection around an upper and lower area without sustained progress. Those labels sound tidy after the fact. During replay, the newest swing is still forming and may disappear from your analysis a few candles later.
That uncertainty is the part worth practicing. A swing high cannot be fully confirmed at the instant price prints the high because later candles must fail to exceed it. The same problem applies to a swing low. If you wait until the whole chart is visible, confirmation feels immediate. If you reveal one bar at a time, you must distinguish a possible turning point from a confirmed one.
Use simple language on the chart. Mark a possible high as PH and a possible low as PL. Once later price action establishes the turn under your chosen rule, change the label to SH or SL. Your rule might require two completed candles on the right side of the turning point. It could instead require a close beyond a nearby reaction level. The exact convention matters less than applying the same convention for the entire sample.
Do not mix structure labeling with trade entry at first. Calling a higher low does not require you to buy. It only records your reading of the visible sequence. Separating observation from action makes errors easier to diagnose. When a label changes, you can ask whether the chart changed or whether your rule was vague.
TradingView's Bar Replay controls hide later bars and let you move through historical data. Start with ChartDojo's Bar Replay practice guide if you need help with the platform controls. For this exercise, use manual one-bar advances. Automatic playback moves too quickly when you are still learning to write a decision before each reveal.
Set up the candle-by-candle structure drill
Choose a liquid market and a timeframe you already understand. Five-minute charts create many decisions but can bury the basic sequence in noise. Daily charts move slowly and may encourage you to rely on remembered news. A 15-minute or one-hour chart is a practical starting point. Keep the same interval through one session so the meaning of a swing does not change halfway through the exercise.
Pick a historical start date without inspecting the later move. Open only enough preceding data to provide context. A window of roughly 40 to 60 visible candles is usually workable, though this is a practice setting rather than a statistical rule. Hide indicators for the first pass. The goal is to read price structure, not to let a moving average choose the label for you.
Create a sheet with one row for each decision checkpoint. Record the time shown on the chart and your current structure label. In a separate field, write the price that would make that label untenable. Add a short reason written in observable terms. "The latest pullback low remains above the prior confirmed low" is useful. "Price looks strong" is too elastic to grade.
Advance one candle. Before doing anything else, compare the new bar with the invalidation condition you wrote. If nothing changed, keep the prior label. If the condition was met, revise the label and record why. Never erase the earlier answer. The revision history is the evidence you need at the end of the session.
Continue for 25 candles or until the chart enters a state your rules cannot classify. Stopping on ambiguity is allowed. Write "unclear" and state what price would need to do before you could assign a label again. Forcing every candle into an uptrend or downtrend creates certainty that was not present on the screen.
Run the drill in this order:
- Freeze the chart at the first checkpoint and mark only confirmed swings.
- Add PH or PL beside the newest possible turning point.
- Write one invalidation condition in your worksheet.
- Reveal a single candle and compare it with that condition.
- Keep, confirm, or retire the provisional label without deleting the original note.
- Repeat until the chosen candle count is complete.
This method is slower than clicking through a chart and circling clean turns. That is intentional. The pause turns a visual impression into a recorded decision. It also exposes how often a trader changes the definition of a swing to fit the candle that just appeared.
Use a consistency scorecard, not a prediction score
A structure drill should not award points because the next candle rose after you wrote "higher low." One bar of follow-through does not validate the quality of the label. It may only reward a lucky guess. Score whether you used your own rule with the information visible at the checkpoint.
Score each checkpoint on a 0-2 scale for the four items below. Zero means the item was absent. One means it was present but vague. Two means it was explicit before the next candle appeared. The maximum is eight points per checkpoint. Keep any simulated trade result in another column so it cannot overwrite the process grade.
| Score item | 0 points | 1 point | 2 points |
|---|---|---|---|
| Swing rule | No stated rule | Label with unclear test | Visible condition named |
| Status | Possible and confirmed mixed | Status implied | Provisional or confirmed stated |
| Invalidation | No invalidation | General area | Specific price condition |
| Revision discipline | Old answer erased | Revision added late | Original preserved and change explained |
Calculate two session measures. First, divide total points earned by total points available. Second, count how many revisions were caused by a genuine invalidation rather than an unstated rule change. A lower score tells you where the process broke. It does not tell you whether the market is tradable or whether a strategy has an edge.
Suppose you complete ten checkpoints. Eight have a stated invalidation, but only five distinguish provisional swings from confirmed swings. The review target is obvious: status labeling needs work. You do not need to add more indicators or search for a different pattern. Repeat the same drill until the distinction becomes consistent.
The scoring rule also protects you from hindsight. A decision can earn full points even when the next candle invalidates it. The label was reasonable under the stated convention and you responded correctly when price changed. A label that happened to survive can still earn a poor score if the reasoning was added later.
A worked market-structure replay example
Imagine a one-hour chart with a confirmed swing low at 100 and a confirmed swing high at 108. Price pulls back to 104, then closes at 105. You mark 104 as PL because the market has not yet satisfied your two-candle confirmation rule. Your note reads: "Possible higher low while 100 remains intact. Confirm after two completed candles hold above 104."
The next candle trades down to 103.50 and closes at 104.25. The earlier possible low no longer meets your rule, so you retire the 104 label. You mark 103.50 as the new PL. Nothing about that revision is a failure. The latest bar changed the candidate turning point, and your first note already described how confirmation would work.
Another candle closes at 105.50 without breaking 103.50. You still do not confirm the low because only one candle has completed to its right. After the following candle closes at 106.25, you change PL to SL. Since 103.50 remains above the earlier confirmed low at 100, you can describe the sequence as a higher low under the convention chosen for this session.
Now price rises to 107.75 but fails to exceed the prior high at 108. You should not label a new higher high. The correct state is unfinished. If the next candle closes below 103.50, your recent higher-low read is invalidated. If price instead breaks 108 and later confirms a new turning point, the rising sequence gains another piece of evidence.
This example shows why fixed language matters. "Bullish" might remain in your notes through every candle, even as the provisional low changes. Price-based conditions force a cleaner update. They also make it possible for another person to review the worksheet without guessing what you meant.
Repeat the example with a deliberate range. When price keeps rotating between established boundaries, resist inventing a trend after every short move. Mark the boundaries and use "unclear" between them. The ability to withhold a label is part of accurate reading. Markets do not owe the worksheet a neat sequence.
Review the session and choose the next drill
After the final candle, zoom out and inspect the completed segment. Do this only after your notes are locked. Compare the obvious finished structure with the sequence of provisional decisions you actually made. The finished chart is useful for review, but it must not replace the record of uncertainty.
Circle each checkpoint where you changed a label. Classify the change as rule-based or discretionary. A rule-based change followed a condition written in advance. A discretionary change relied on a feeling or a new definition. Count both, then write one sentence about the most common source of drift.
If most errors came from confirming swings too early, repeat the exercise with the same confirmation rule. If most came from shifting timeframes, lock the interval and remove the shortcut from your platform layout. Change only one part of the practice design at a time. Otherwise you will not know which adjustment improved consistency.
Do not use a familiar chart for the next scored session. Recognition can turn replay into memory testing. Pick another symbol or a different month. The 20-minute chart-pattern practice routine offers a useful daily cadence when you want to fit this drill into a broader training plan.
Keep the worksheet for comparison across sessions. Look for a rising process score and fewer discretionary revisions. Those are modest claims you can support with your own records. A strong simulation score still does not promise live results. Orders may fill differently, risk feels different when money is involved, and historical replay cannot reproduce every market condition.
FAQ
What counts as a swing high or swing low?
Use a rule you can apply without seeing future bars. One simple convention treats the turning point as provisional until a fixed number of candles forms on its right. Other conventions use a close through a nearby reaction level. Pick one before the session and keep it unchanged.
How many candles should I reveal in each Bar Replay session?
Twenty-five candles is enough for a focused beginner drill without making review unwieldy. The number is a practical limit, not a market law. Use fewer if each checkpoint requires detailed notes. Consistent attention matters more than racing through a large sample.
Should I mark market structure with wicks or candle closes?
Either convention can work for practice if it is defined first. Wick-based rules capture the full traded range. Close-based rules wait for price acceptance at the end of the bar. Do not switch between them after seeing which choice produces the cleaner result.
Can market structure predict the next move?
Market structure describes the visible price sequence. It does not guarantee the next direction. Use the drill to improve classification and invalidation discipline. Test any trading method separately, with realistic assumptions and risk controls.
When should I add indicators to the exercise?
Add one only after you can label price structure consistently without it. State what decision the indicator is meant to support. If it does not change a specific checkpoint, it is probably adding visual noise rather than useful feedback.
Where ChartDojo fits
Bar Replay controls which candles you can see. It does not tell you whether your swing label was specific, whether your invalidation was written early enough, or whether a winning result hid a weak decision. ChartDojo sits between ordinary paper trading and live trading as chart practice with AI grading on decision quality.
The rhythm is follow-first. Commit to the read before revealing what happened. Then inspect the feedback. Come back the next day with one process correction. AI-powered feedback helps you examine the decision before real capital is involved. Build real skills, not bad habits. Start a free ChartDojo trial when you want paper trading practice with structured feedback.