
TL;DR
On Tuesday, June 16, 2026, President Trump told reporters the framework US-Iran peace deal already covers 99.9 percent of what he wants, with the Strait of Hormuz set to reopen by the end of this week and a formal signing ceremony scheduled for Friday in Geneva. Pakistan brokered the agreement. WTI crude is trading near $80 and Brent near $81.55, the lowest level since early March 2026. S&P 500 futures wavered in early US trading as the energy relief offset some persistent macro headwinds, gold held its gain on residual safe-haven flow, and bitcoin stabilized in the mid-60K range. For traders, this is a fast cross-asset reprice that touches oil, US equity index futures, gold, and crypto at the same time.
What happened with the US-Iran deal today
Bloomberg, CNBC, NBC News, NPR, and CBS News all carried the same core story on Tuesday. President Trump said the framework agreement, signed electronically on Sunday after Pakistan-mediated talks in Islamabad, already includes 99.9 percent of what he wants from Iran. The formal signing ceremony is now scheduled for Friday, June 19, 2026, in Geneva. Iran's foreign minister and a US delegation are both expected to attend.
Trump also signaled he could send the deal text to Congress, which is the political path for a treaty-style document and a signal that the White House wants legislative cover for the package rather than relying purely on executive authority. Pakistani Prime Minister Shehbaz Sharif confirmed his country's mediation role over the weekend and said the final text was agreed after more than 100 days of war.
The most market-relevant clause is the reopening of the Strait of Hormuz. Trump said the chokepoint, through which roughly 20 percent of global oil supply flows, will be reopened by the end of this week. That single line removes the worst-case tail risk that crude markets had been pricing since the early-June escalation.
Why markets moved on the Iran deal: oil, futures, and gold reprice
Crude oil did most of the work. WTI traded near $80 a barrel in early US hours and Brent traded near $81.55, both at the lowest levels since early March 2026. That is roughly a $14 to $16 round trip from the early-June peak when traders were pricing a year-long Hormuz disruption. The supply-side narrative has flipped from blockade to restart.
US equity index futures wavered rather than ripped. The reason is that the same deal that cuts oil also cuts the inflation tail that had been pushing the Fed path higher. Lower crude is a clean tailwind for transports, refiners, and broad index multiples, but the immediate move on June 16 was choppy as traders unwound long energy positions and rotated into rate-sensitive names. SpaceX (SPCX) extended its post-IPO rally, adding to the noise in the index print.
Gold held its overnight gain. The deal narrative is bearish for safe-haven flows over time, but the market is not paying for war risk anymore. It is paying for the path of real rates, a softer dollar, and the politics of a US-Iran framework that could still slip in Geneva on Friday. When we tested this on chartdojo.io with our own bar replay scenarios, gold tended to hold its level for several sessions after the first round of risk-off unwind because positioning takes time to clear.
Bitcoin traded in the mid-60K range. Crypto behaved like a risk asset on the macro headlines but did not pick up a meaningful safe-haven bid. The BlackRock BITA premium income ETF launch earlier today and the BOJ rate hike to 1.0 percent are still the dominant inputs into the BTC tape this week.
Implications for traders
Stock traders see two opposing forces. Lower crude is a margin tailwind for transports, airlines, retailers, and refiners' downstream segments. It is a headwind for upstream energy names that had been priced for a sustained $90-plus Brent regime. Defense primes give back the geopolitical premium they had built since early June. The S&P 500 is more likely to grind higher than spike on this catalyst, because the rotation underneath is heavy.
Futures traders should watch ES, NQ, and CL together. WTI futures (CL) have been the cleanest expression of the Iran trade for weeks and are now the cleanest expression of the deal trade. ES and NQ get a softer Fed path through lower headline inflation, but the dollar move and the rates curve will decide how much of that flows into multiples.
Crypto traders have less direct exposure, but a calmer macro tape is constructive for BTC and ETH. The combination of a Hormuz reopening, the BITA ETF debut, and a Warsh-led FOMC meeting later this week could compress crypto volatility.
Potential positives vs negatives from the Iran deal
Positives. Lower crude reduces the inflation tail and gives the Fed more room to keep the cutting bias intact under new Chair Warsh. Refiner margins improve as crack spreads adjust. Transports, airlines, and consumer discretionary get a cost tailwind. Equity volatility resets lower, which compresses option premium and helps long-only allocators rebuild risk.
Negatives. Upstream US energy names lose the easy bid that had carried them through the spring. Defense primes that priced sustained regional escalation give back some of that premium. Any signing-day slip in Geneva on Friday can snap oil higher by several dollars in a single session. The deal still needs to survive Iranian parliamentary review and a possible US Senate role, both of which can introduce tape-moving headlines for weeks.
What could happen from here: base, upside, downside
Base case. The Friday signing in Geneva goes through, Hormuz traffic normalizes over the following week, Brent stabilizes in the $78 to $84 range, and S&P futures grind toward new highs as the Fed path turns slightly more dovish. Confirm with: clean signing photo from Geneva, IMO and tanker tracking data showing Hormuz transits returning to baseline, and Brent holding above $76. Invalidate with: any last-minute Iranian objection or a Hormuz incident.
Upside case. Both sides sign, Iran releases additional barrels into the market faster than expected, and OPEC+ accommodates the return without retaliation. Brent breaks $78 to the downside, WTI prints a $75 handle, the S&P 500 sets a fresh record, and gold pulls back toward $2,100. Confirm with: explicit OPEC+ statement of cooperation and a public Iran export ramp schedule. Invalidate with: Saudi or UAE pushback on quota erosion.
Downside case. The Geneva signing slips, an Iranian hardline faction blocks ratification, or a Hormuz-area incident interrupts the reopening. Brent spikes back above $88 within a session, gold breaks $2,200, and the S&P pulls back two to three percent on a vol expansion. Confirm with: any official Iranian statement walking back the framework or a tanker incident. Invalidate with: a clean signing on Friday and visible US Navy escort drawdown.
What to watch next 24 hours
- Pre-signing language from Tehran and any Iranian parliament headlines before Friday.
- Brent and WTI hourly closes and whether the three-month low holds or breaks lower.
- S&P 500 futures (ES) at the prior breakout level and Nasdaq futures (NQ) reaction to a softer crude print.
- Gold and the dollar index for confirmation that the safe-haven unwind is real.
- Warsh's first FOMC meeting later this week and any reference to the new energy backdrop.
- Hormuz transit data from MarineTraffic and tanker-tracking feeds.
FAQ
When is the US-Iran deal being signed? Friday, June 19, 2026, in Geneva, Switzerland, with Pakistan as the mediating party.
Is the Strait of Hormuz already reopened? Not yet. Trump said the chokepoint will reopen by the end of this week. Tanker traffic data over the next several sessions will confirm the actual restart.
Sources used
- Bloomberg: US Futures Waver as Oil Drops on Iran Hope
- CNBC: Trump signals he could send Iran deal to Congress
- NBC News: US and Iran reach framework deal to end war and reopen Hormuz
- Bloomberg: Gold Advances as Trump Touts Reopening of Hormuz This Week
- Fortune: Current price of oil as of June 16, 2026
Related ChartDojo coverage
- Warsh's First FOMC Meeting: Cross-Asset Rate Path Repricing
- BOJ Hikes to 1.0%: Yen, Nikkei, Carry Trade Risk Map
- How to Use TradingView Bar Replay for Trade Practice (2026 Guide)
Train for the next Hormuz headline on ChartDojo
Geopolitical reversals like this Iran deal compress and expand cross-asset risk inside a single session. The traders who handle them well are the ones who have already practiced these tape moves on real charts, not the ones who improvise live. Open a ChartDojo free trial and run the past two weeks of crude, S&P futures, and gold through bar replay with AI-powered feedback. Build real skills, not bad habits. Start your free trial at chartdojo.io/register.
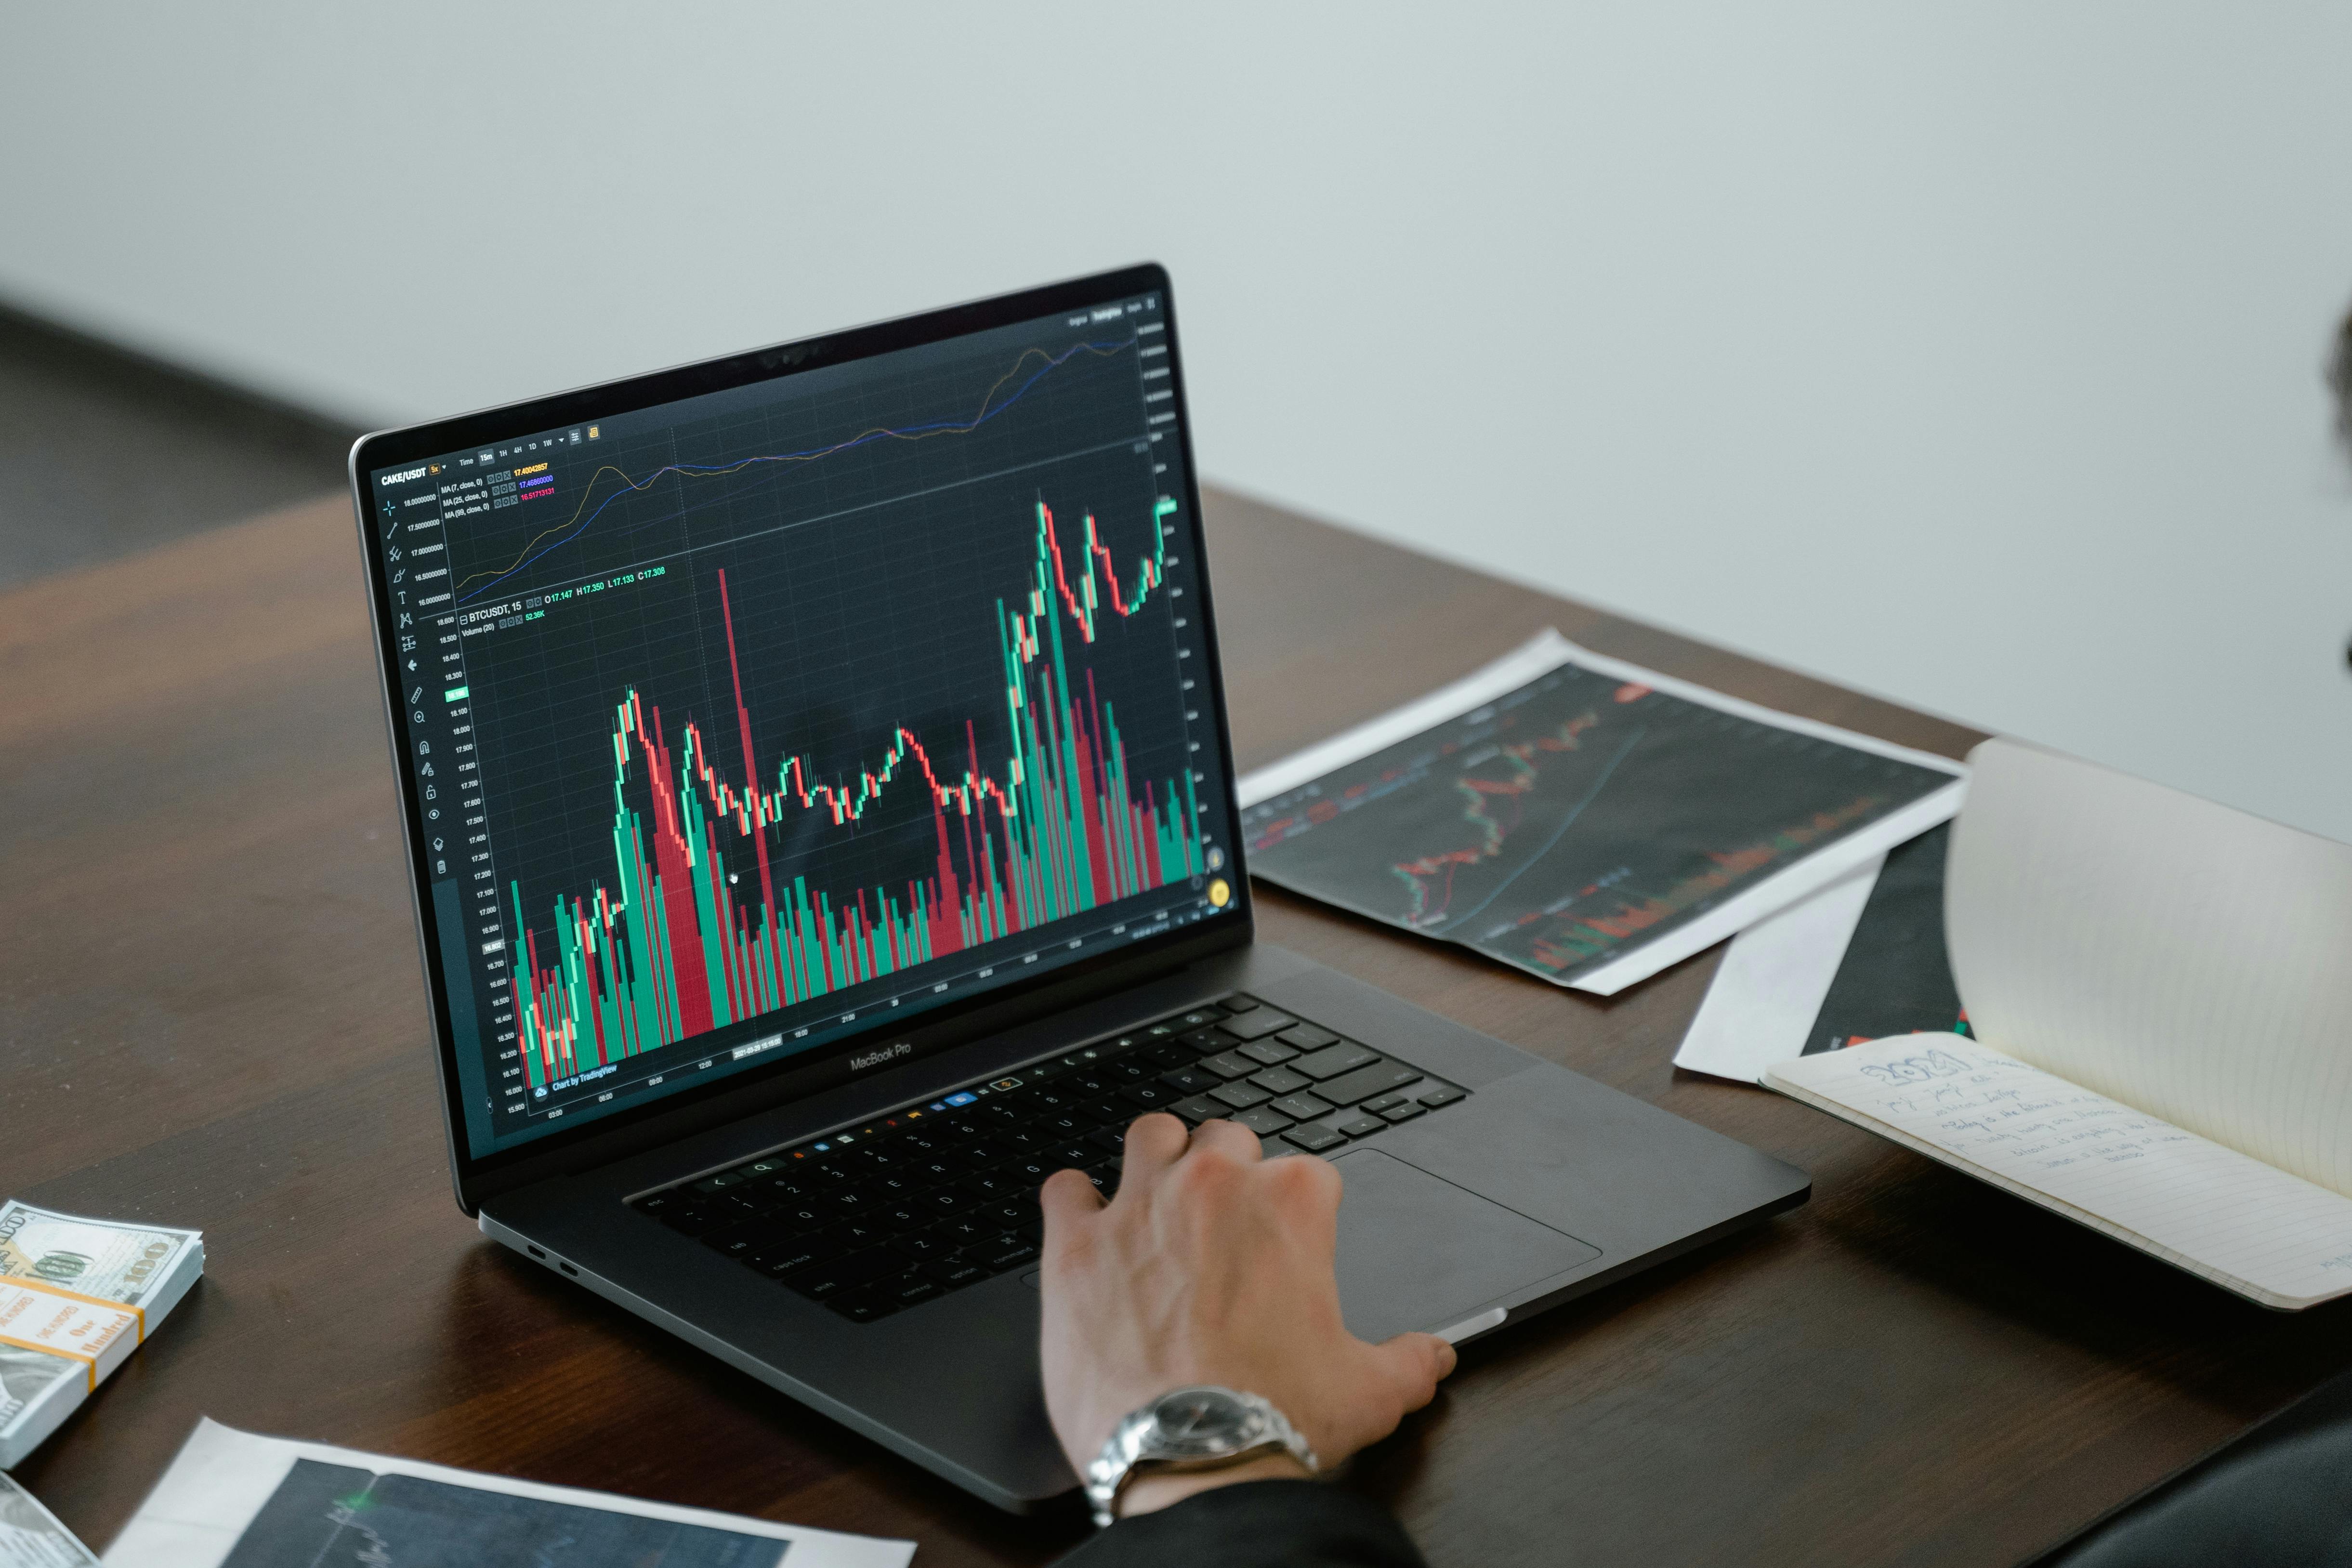
Header image source: pexels by Mikhail Nilov. License: PEXELS.