
If you want to practice risk-reward ratio decisions with paper trading, the arithmetic is the easy part. The harder skill is deciding whether the stop belongs at a meaningful invalidation level, whether the target is plausible, and whether you can follow that plan after price starts moving. A clean 1:2 ratio on an order ticket can still describe a weak trade.
This guide turns the ratio into a ten-trade practice drill. You will record the reward you planned in units of risk, compare it with the result you actually realized, and grade the decision separately from the profit or loss. The goal is not to force every setup into the same ratio. It is to see where your execution changes the trade you thought you were taking.
TL;DR
- Define 1R as the amount between your planned entry and invalidation-based stop, multiplied by position size.
- Write the planned target and planned R before revealing or advancing future price.
- Record realized R after the exit, including simulated slippage or fees when the platform supports them.
- Grade stop logic, target logic, and plan adherence without changing the grade because the trade won or lost.
- Use the ten-trade worksheet below to find execution drift. A fixed 1:2 target is not proof of an edge.
What risk-reward ratio can and cannot tell you
Traders use two opposite naming conventions. A "1:2 risk-reward ratio" often means risking one unit to pursue two units of reward. Other material calls the same trade a 2:1 reward-to-risk ratio. To keep the worksheet clear, this article uses R-multiples: risk is 1R, a full planned loss is -1R, and a target twice as far from entry as the stop is +2R.
For a long stock trade, suppose the entry is $50 and the stop is $49. The price risk is $1 per share. If the position contains 100 shares, 1R equals $100 before costs. A target at $52 offers a planned +2R because the target is $2 above entry. The same method works for a short trade by reversing the price direction.
That ratio describes the shape of one plan. It does not tell you how often the setup wins. It also does not prove that the target is reachable in the available time or liquidity. A trader can manufacture a prettier ratio by placing the stop too close to normal price noise or by choosing a distant target with little structural support. The number looks better while the decision gets worse.
Expectancy connects payoff and frequency. In a hypothetical sample with a 40 percent win rate, an average +2R win and an average -1R loss produce +0.2R per trade before costs: (0.40 x 2R) + (0.60 x -1R). If early exits reduce the average winner to +1.3R, the same win rate produces -0.08R per trade. Neither example predicts future results. They show why the planned ratio and the realized payoff need separate columns.
A stop order also controls an instruction, not a guaranteed fill. The SEC's Investor.gov explains that a stop order becomes a market order once the stop price is reached, so the execution price can differ from the stop price. Paper fills may look cleaner than live fills during fast moves. Add a conservative slippage assumption when your simulator allows it, and treat a perfect simulated fill as a practice result rather than a promise.
How to practice risk-reward ratio with paper trading
Choose one setup definition for the full exercise. It might be a pullback to prior support or a breakout followed by a retest. Keeping the setup constant makes comparison easier. If you change the market or timeframe on every row, then change the entry rule too, you will not know whether the ratio changed because of the setup or because you changed the experiment.
Hide future candles in bar replay or wait for a live paper-trading setup. Mark the price that would disprove the idea before calculating quantity. If stop placement is still the weak link, use the separate stop-loss placement drill with bar replay first. The stop belongs where the premise fails, with an execution buffer suited to the instrument. It should not be moved simply to create a round ratio.
Next, identify a target that the chart can support. Useful evidence may include a prior swing, the other side of a range, or a level where the setup's premise would have played out. Calculate planned R only after the entry and stop have independent reasons. Confirm the target separately. If the ratio is unattractive, skip the trade. Do not drag the target farther away until the number looks acceptable.
Set quantity from the risk budget and stop distance. The related paper-trading position sizing exercise shows the calculation in detail. For this drill, use the same fixed simulated risk budget on every row. A constant 1R lets you compare decisions even when the share or contract quantity changes.
Write the plan before advancing price. During the trade, follow the exit rule you stated. If your rule permits a partial exit or a trailing stop, define that before entry and calculate realized R from the blended result. An improvised early exit counts as drift even when it saves money. A planned partial exit does not.
The ten-trade planned-versus-realized R drill
Run ten paper trades with one setup and one fixed definition of 1R. For each trade, capture the entry and stop, followed by the target and quantity. Record planned R beside realized R, then state the reason for any difference. Use prices from the simulator's actual fills when available. If the simulator omits costs, note a simple fixed fee or slippage assumption instead of pretending the fill was frictionless.
Use this grading rule before looking at the outcome:
- A: The stop was tied to invalidation, the target had chart support, and the stated exit rule was followed.
- B: The plan was usable, but one judgment was weak or insufficiently documented.
- C: The ratio was engineered, the stop or target lacked a reason, or execution broke the stated rule.
The table below is a hypothetical filled example. It is not a performance claim. "Planned R" is the target distance divided by initial risk. "Realized R" is the net simulated result divided by that same initial risk. The grade evaluates the decision process, not whether the row is green.
| Trade | Planned R | Realized R | Grade | Decision note |
|---|---|---|---|---|
| 1 | 2.0R | 1.8R | A | Target reached; simulated cost deducted |
| 2 | 1.5R | -1.0R | A | Valid stop; plan followed |
| 3 | 2.0R | 0.7R | C | Exited early without a stated trigger |
| 4 | 2.5R | -1.2R | C | Moved stop after entry |
| 5 | 1.8R | 1.8R | A | Target reached as planned |
| 6 | 2.0R | 1.2R | B | Planned partial exit; weak documentation |
| 7 | 1.5R | -0.5R | B | Valid early invalidation; trigger was vague |
| 8 | 3.0R | -1.0R | A | Valid stop; distant target had structure |
| 9 | 2.0R | 2.0R | A | Target reached as planned |
| 10 | 1.8R | 0.4R | C | Exited from discomfort, not the rule |
In this sample, planned targets total 20.1R, so the average planned target is 2.01R. Realized results total +4.2R, or +0.42R per trade. The six winning rows planned 11.6R of reward and captured 7.9R, about 68 percent. The most useful finding is not the positive total. Three C grades identify repeatable execution problems: two unplanned early exits and one widened stop.
Do not treat ten trades as enough evidence that a strategy has an edge. Ten is a practice block, not a statistically reliable conclusion. Repeat the block only after choosing one behavior to correct. For example, the next block could require every early exit to name a prewritten trigger. That creates a clean test of process improvement.
Worked example: a planned 2R trade that realizes 1.3R
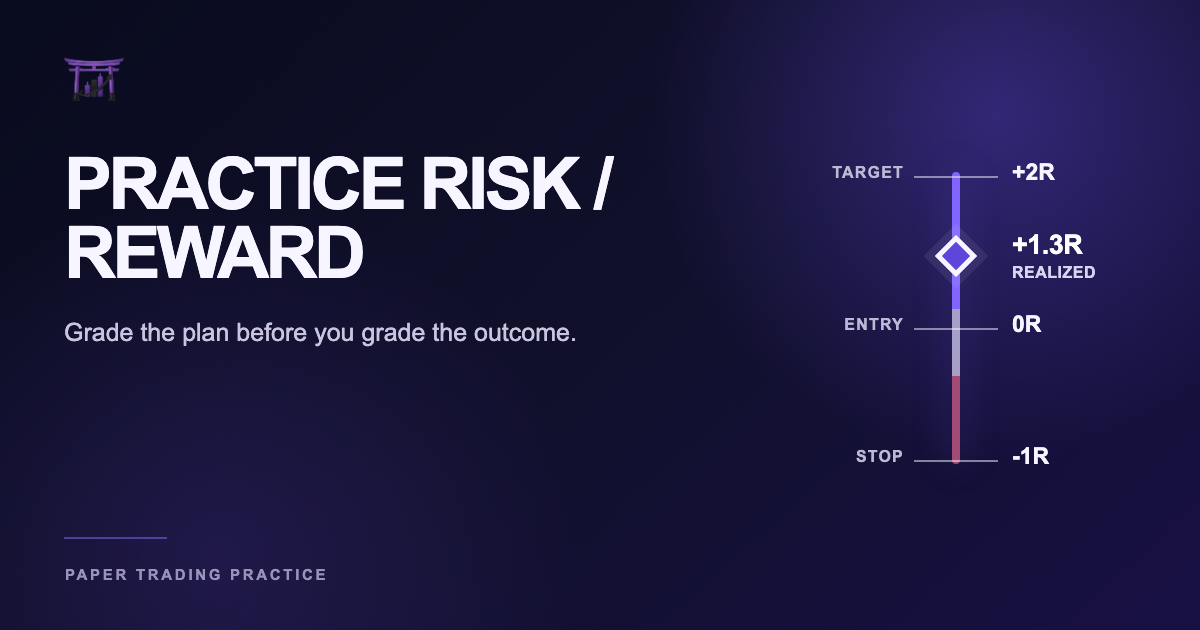
Assume a hypothetical long entry at $50, an invalidation stop at $49, and a target at $52. With 100 shares, the initial risk is $100. The planned reward is $200, so the plan is +2R. Before entry, the trader writes one exit rule: hold for the target unless a candle closes below a defined support level.
Price rises, then momentum slows at $51.30. The trader closes the full position even though support still holds. The simulated gain is $130 before costs, which equals +1.3R. The trade made money, but the decision grade is C because the exit broke the stated rule. If the trader had written a momentum-based exit before entry and the condition had triggered, the same +1.3R result could earn an A.
This distinction prevents hindsight from rewriting the lesson. A profit does not repair an impulsive decision, and a stopped trade does not invalidate a sound plan. Compare planned R with realized R, then read the decision note. The gap is diagnostic only when you know why it appeared.
How to grade the decision without worshipping the ratio
Start with stop quality. Ask whether the level represented genuine invalidation when the order was planned. Then inspect target quality. The target should have a reason that exists independently of the desired ratio. Finally, check adherence: did the trader follow the exit rule, including any planned partials? Keep each judgment short enough that a second reviewer could agree or disagree.
Review winners and losers together. If all losing rows receive C grades by default, the exercise has become an outcome score. An A-grade loss is normal when the setup was valid and the plan was followed. A C-grade winner deserves attention because favorable price movement can hide a habit that later increases losses.
Look for one repeated cause, not a grand theory. Early exits may show that the target is poorly supported, but they may also show discomfort with open profit. Widened stops may reveal weak invalidation logic or refusal to accept the planned loss. The worksheet does not diagnose motive by itself. It points you to the next practice question.
FINRA warns that day trading can be extremely risky, and CME's trade-plan education treats risk limits as decisions that belong in the plan. Paper trading removes real-money loss from the exercise, but it does not remove the need for limits. Keep the simulated risk budget realistic and stop the session when your written daily limit is reached. Rehearsing unlimited resets teaches a behavior that a live account cannot afford.
FAQ
What is a good risk-reward ratio for paper trading?
There is no universal ratio that makes a setup good. A planned +2R target is useful only when the stop marks invalidation and the target is plausible. Practice several valid setups, then compare expectancy and execution across a larger sample.
Should I count fees and slippage in realized R?
Yes, when the simulator provides them. If it does not, document a conservative assumption that fits the instrument. Keep the method consistent across the ten-trade block so the rows remain comparable.
Why can realized R be less than planned R on a winning trade?
Partial exits or trailing stops can reduce the result. Slippage can do the same, as can an early discretionary exit. The decision note should show whether the difference came from a prewritten rule or from drift after entry.
Can a losing trade receive an A grade?
Yes. If the setup was valid, the stop and target had clear reasons, and execution followed the plan, the decision can be sound even when price reaches the stop.
Are ten paper trades enough to validate a strategy?
No. Ten trades are enough for a focused practice block and a review conversation. Strategy validation usually needs a much larger sample across relevant market conditions, with a method chosen before reviewing results.
Where ChartDojo fits
ChartDojo sits between ordinary paper trading and live capital. You practice chart decisions, then receive AI-powered feedback on decision quality instead of judging the session only by profit. Use the ten-trade drill to make the feedback specific: define the stop and target before price unfolds. State the exit rule too, then compare the plan with the result. Start a free trial and build real skills, not bad habits.
Sources
- Investor.gov: Stop, Stop-Limit, and Trailing Stop Orders
- CME Group: Risk Management and Your Trade Plan
- FINRA: Day-Trading Risk Disclosure Statement
- Charles Schwab: Elements of a Smart Trade Plan
Header image: ChartDojo original visual.