
TL;DR
- Position sizing starts with a risk budget and a price level that proves the trade idea wrong. Quantity comes last.
- Paper trading lets you repeat the calculation without risking cash, but simulated fills and losses do not reproduce live trading.
- Use the 12-decision drill below to practice one setup across different stop distances and account conditions.
- Grade the decision before looking at profit. A winning simulation can still contain a sizing mistake.
- ChartDojo adds AI-powered feedback on decision quality between paper trading and live trading.
Position sizing often gets taught as one formula: divide the amount you are willing to risk by the distance between entry and stop. The arithmetic is useful. The hard part comes before it. You must decide what loss the practice account can absorb and where the trade idea becomes invalid.
That is why paper trading position sizing should be a drill, not a one-time calculator exercise. A trader who can solve the equation slowly may still freeze when the stop is wider than expected or quietly increase risk after two simulated losses. Good practice makes those decisions visible.
This guide gives you a worked example and a 12-decision worksheet. The purpose is not to prescribe a universal risk percentage. It is to help you rehearse a repeatable process while the stakes are simulated.
Position sizing is two decisions, then a calculation
The first decision is the risk budget. This is the maximum planned loss for the trade before costs. Slippage or a gap through the stop can raise the final loss. The budget can be stated in dollars or as a fraction of the practice account. There is no percentage that fits every person or market. The product matters too. Account size and financial circumstances matter. So do the instrument's volatility and the possibility of losing more than planned.
The second decision is the invalidation level. A stop should correspond to the point where the stated trade idea no longer holds. Choosing a convenient dollar distance first and forcing the chart to fit it reverses the process. The chart decision defines the distance. The risk budget limits the quantity.
Only then do you calculate units:
Position size = planned dollar risk / risk per unit
For a long stock position, risk per share is usually the planned entry price minus the stop price. For a short stock position, it is usually the stop price minus the entry. Futures and options require product-specific values. Leveraged products and foreign exchange can have more complex loss behavior too. Use the broker or exchange specification for the exact product rather than carrying a stock formula into another market.
A stop order also does not guarantee the stop price. The SEC explains that a stop order becomes a market order when its stop price is reached, so the execution price can differ in a fast market. Treat the formula as planned risk, not a promise about the final loss.
A worked position-size practice example
Suppose a paper account shows $10,000. For this exercise, the trader sets a $50 maximum planned loss on one stock idea. That $50 is an example chosen for the drill, not a recommendation.
The chart shows a possible entry at $42.50. The idea depends on price holding above a prior swing low at $41.25. The trader places the practice stop at $41.25 because a move below that point would invalidate the setup as defined. The distance is $1.25 per share.
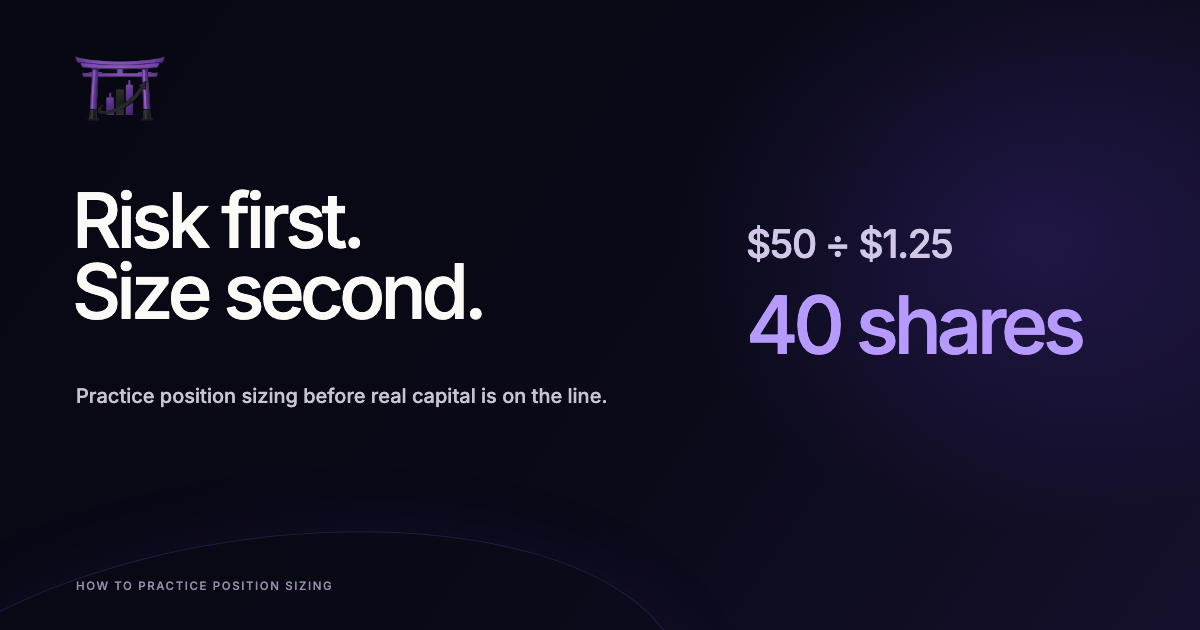
The calculation is $50 divided by $1.25, which equals 40 shares. At a $42.50 entry, the position's market value would be $1,700. If price reached the planned stop and filled exactly at $41.25, the loss would be $50 before costs.
| Input | Value | Why it comes in this order |
|---|---|---|
| Practice account | $10,000 | Sets the exercise context |
| Maximum planned loss | $50 | Defines the risk budget |
| Planned entry | $42.50 | Marks the decision price |
| Invalidation stop | $41.25 | Comes from the trade thesis |
| Risk per share | $1.25 | $42.50 minus $41.25 |
| Calculated quantity | 40 shares | $50 divided by $1.25 |
Now change one input. If the valid stop must sit at $40.50, the risk per share becomes $2.00. The same $50 budget allows 25 shares. The wider stop does not justify taking more risk. It calls for a smaller position.
What if the platform does not allow the calculated quantity, or the position exceeds a buying-power limit? Round down or skip the practice trade. Do not move the stop closer simply to make the quantity fit. A constrained result is information. It may show that the account or product is a poor match for the setup.
The 12-decision paper trading position-sizing drill
Choose one liquid instrument and one setup you can describe in a sentence. Use historical replay or a paper trading platform that hides future price action. The guide to practicing trading without losing money explains how the available practice layers differ.
Before the first chart, write the exercise risk budget and leave it unchanged for all 12 decisions. This isolates the sizing process. If you change the budget after each result, you will be practicing reactions to simulated profit instead of practicing the rule.
Run four blocks with three decisions in each block:
| Block | Decisions | Constraint | Skill being tested |
|---|---|---|---|
| 1 | 1 to 3 | Normal volatility | Basic calculation and rounding |
| 2 | 4 to 6 | Wider valid stops | Reducing quantity without moving the stop |
| 3 | 7 to 9 | One trade must be skipped | Respecting account or product constraints |
| 4 | 10 to 12 | After two simulated losses | Keeping the written budget stable |
At each decision point, freeze the chart. Write the setup in one sentence. Mark the entry and the price that would disprove that setup. If you cannot state why the stop belongs there, label the example unclear and skip it. An unclear stop does not become valid because a calculator accepts the number.
Next, calculate the per-unit risk and quantity. Round down to the nearest quantity the platform accepts. Check market value and buying power. For a product with a multiplier, include it in the calculation and confirm it against official contract specifications.
Place the simulated order only after those fields are fixed. Save the planned values before advancing the replay. After the outcome appears, record the actual simulated fill and loss, but do not edit the original decision.
Repeat the same historical chart only if you are testing a specific correction, such as a quantity error. Otherwise move to a fresh chart. Remembering the next candle can make the decision look easier than it was.
Grade sizing quality before simulated profit
Profit answers what happened in that price sequence. It does not tell you whether the quantity was calculated from the written rule. Keep the two questions separate.
Score each of the 12 decisions with one point for every yes:
- Was the risk budget written before the chart advanced?
- Did the invalidation level match the stated setup rather than the desired quantity?
- Was the per-unit risk calculated correctly for the instrument?
- Was the final quantity rounded down when necessary?
- Did the trader skip the setup when constraints could not be met?
A five-point decision followed the exercise. A four-point decision needs one named correction. Three points or fewer means the process broke before the order was placed. Do not rescue that score because the paper trade made money.
After 12 decisions, total each error type instead of averaging profit. A repeated arithmetic error calls for slower calculation. A repeated stop error means the setup definition needs work. If the risk budget changes after losses, the problem is rule adherence. These are different practice targets.
The article on deliberate practice for traders shows why one correction per session is more useful than collecting random screen time. Carry the most frequent sizing error into the next set of 12 decisions and keep every other part of the drill stable.
Common mistakes this drill exposes
The first mistake is sizing from buying power. A platform may allow a large position, but available buying power is not a risk plan. The relevant question is how much could be lost if the idea is wrong and the order fills worse than expected.
The second is moving the stop to preserve quantity. Imagine that 50 shares fit a preferred number, but the stop required by the chart makes the planned loss too large. Pulling the stop closer can change the trade thesis. Reduce quantity or skip the setup instead.
Another mistake is treating every instrument like a share of stock. Futures use contract multipliers. Options can change value nonlinearly, and spreads introduce assignment or liquidity details. Leveraged foreign exchange and crypto products can carry their own liquidation rules. Paper practice is a good place to learn the ticket, but product documentation must supply the calculation inputs.
Simulated fills create a final trap. The CFTC requires warnings on presentations of hypothetical performance because simulated results have inherent limitations and do not represent actual trading. A paper platform may not reproduce queue position or partial fills. Spread changes and the emotional effect of a real loss may also be absent. Add a conservative fill assumption when reviewing the exercise, and keep claims about transfer to live trading modest.
The drill is successful when the decision process becomes consistent, not when the twelve-trade result is positive. Twelve observations are far too few to establish that a strategy has an edge. They are enough to reveal whether you repeatedly break the same sizing rule.
FAQ
What percentage should I risk per trade when paper trading?
There is no universal percentage. Choose a small hypothetical risk budget that lets you practice the process, then keep it fixed for the drill. A real-money decision depends on personal finances, product risk, and the possibility that an order fills beyond the planned stop.
Should position size come before stop placement?
No. Define the entry and invalidation level first. Their distance determines risk per unit. The written risk budget then determines quantity.
Do I count a profitable paper trade as a good sizing decision?
Only if the sizing process also followed the rule. Profit can result from an oversized or poorly defined trade. Grade the decision separately from the outcome.
Can paper trading show my true maximum loss?
It can estimate planned loss under the simulator's assumptions. It cannot guarantee a live fill price. It may also miss spread changes, gaps, and some liquidity or execution conditions. Some products can lose more than the amount suggested by a simple stop-distance calculation.
When should I repeat the drill?
Repeat it after naming one frequent error. Keep the setup and budget stable for the next 12 decisions so you can see whether that correction improved.
Where ChartDojo fits
ChartDojo sits between paper trading and live trading. It provides chart practice with AI-powered feedback on decision quality. A paper account can show whether the simulated order gained or lost. ChartDojo helps review the setup and invalidation. It also checks whether the risk decision made sense before the outcome was known.
Follow one setup on a daily cadence. Complete one position-size decision, review the feedback, and carry one correction into the next chart. Build real skills, not bad habits.
Start a free ChartDojo trial and use the first sessions to practice the most common error from your 12-decision worksheet.