
As of Sunday afternoon, June 7, 2026, US stocks open this week trying to recover from one of the ugliest sessions of the year. The Nasdaq 100 selloff on Friday wiped out roughly 4.5% in a single day, the worst drop since last October, and the VIX volatility index spiked about 28% as traders priced in a renewed risk of a Federal Reserve rate hike before year end. Now the week ahead lines up a real test for the bulls. May CPI lands on Tuesday, Oracle and Adobe report earnings, the European Central Bank decides on rates on Wednesday, and defense stocks like Lockheed Martin and RTX continue to push to fresh records as the Iran war passes 100 days.
TL;DR
- Nasdaq 100 finished last week down about 4.5%, its worst week since October.
- A hotter May jobs report (172,000 new positions) reignited fears of a December Fed rate hike.
- Defense names led the tape: Northrop Grumman, RTX, and Lockheed Martin all printed multi day record runs.
- This week brings May CPI on June 10, ECB on June 11, and earnings from Oracle, Adobe, Chewy, and Lennar.
- Energy and defense are leading sector rotation while semis and high beta growth take the brunt of the selloff.
What happened on Wall Street last week
The week ended in heavy red. The Nasdaq 100 shed 4.5% and the broader Nasdaq Composite fell more than 4.1%, with Nvidia down about 6% in a single day. The S&P 500 followed lower as Treasury yields jumped and dollar volatility climbed. The Cboe Volatility Index, often called the VIX, spiked 28% from sleepy mid teens levels back into the mid 20s. For traders, that move means options premium got more expensive and short term hedges that were on sale all spring suddenly are not.
Two catalysts did the damage. First, a hot US jobs report showed the economy added 172,000 positions in May, well above consensus. Markets read that as proof the labor market is not cooling, which keeps services inflation sticky and gives the Fed room to push back on rate cuts. Second, the Iran war hit its 100 day mark, and a fresh wave of drone strikes near the Strait of Hormuz kept energy prices elevated. Higher oil plus a hot labor market is a textbook stagflation cocktail, and that is exactly the combination the Nasdaq does not like.
Why markets moved (and why it matters this week)
The rate hike repricing is the cleanest read. Fed funds futures now imply roughly a 70% probability of a 25 basis point Fed hike by December, a sharp jump from the start of the month. Higher for longer pressures the long duration growth names that dominate the Nasdaq 100, which is why semiconductors and AI infrastructure plays led the selloff. At the same time, the Iran war premium is still flowing into defense, energy, and select aerospace names, which is why those sectors are sitting near records even as the broad index falls.
For traders, the takeaway is that the market regime is shifting from a single trade (long AI, short volatility) to a sector rotation tape. That is much harder to navigate and rewards discipline over conviction. It is the type of environment where practiced execution beats fresh opinions.
Defense stocks lead the Wall Street week ahead
The clearest equity story of the last seven sessions is the move in major US defense contractors. According to Alpha Spread and Al Jazeera reporting, Northrop Grumman rose about 6% in a single session after the latest round of US and allied strikes, with RTX climbing about 4.7% and Lockheed Martin up about 3.4% on the same day. Lockheed shares are up roughly 40% year to date, supported by a January Pentagon deal to quadruple THAAD interceptor production from 96 to 400 units per year. RTX makes the Patriot system used to intercept Iranian missiles, and Northrop's B 2 stealth bomber was deployed in the recent strikes.
Smaller names are catching the bid too. Kratos Defense surged more than 10% in one pre market session, with L3Harris also climbing. Traders watching the sector should note the difference between the prime contractors (slower revenue compounding, lower beta) and the smaller drone and electronic warfare names (higher beta, more sensitive to headline risk).
Sector implications: where the rotation is going
Friday's tape gave a fairly clean rotation map for active traders:
- Outperformers: Defense (XAR, ITA), energy producers and refiners (XLE, XOP), utilities, and gold miners. These are the classic risk off, geopolitically driven trades.
- Underperformers: Semiconductors (SOXX), high beta growth (ARKK), airlines (JETS, hit by fuel costs), homebuilders (rate sensitive), and small caps (IWM under pressure from credit and rate fears).
- Mixed: Financials. Banks like JPMorgan and Goldman benefit from higher yields but lose if credit risk widens; mega cap tech is split between AI capex winners and rate sensitive losers.
One useful frame for the week is to treat each sector as a separate trade with its own catalyst calendar, rather than betting on one S&P 500 direction. That is what a sector rotation tape rewards.
Potential positives vs negatives
Going into the week, the bull and bear cases are unusually balanced.
Potential positives
- A cooler than expected May CPI print on Tuesday would take the December rate hike call off the front burner and could trigger a sharp short covering rally in semiconductors and growth.
- Strong Oracle or Adobe earnings would reinforce the idea that enterprise AI spending is still resilient, which would help the Nasdaq 100 rebuild a floor.
- Any clear de escalation signal from the Iran war would compress the oil and defense premium and let beaten down high beta names breathe.
- Buy the dip flows are real. A 4.5% weekly drop in the Nasdaq has historically attracted systematic and retail buyers within a few sessions.
Potential negatives
- A hotter CPI print would lock in the December hike narrative and risk a second leg lower for the Nasdaq.
- Weak Oracle or Adobe earnings, especially soft guidance on AI revenue, would compound the semi selloff.
- A hawkish ECB surprise on Wednesday would tighten global liquidity expectations and push the dollar higher, which is rarely friendly for US equities at these levels.
- Any further escalation in the Strait of Hormuz, especially a confirmed disruption to oil shipping, would lift crude and keep defensive rotation in charge.
What could happen from here
Base case: choppy week, sector rotation continues. CPI lands roughly in line, Oracle and Adobe deliver decent but not blowout numbers, the ECB hikes or holds without a major surprise, and the Nasdaq spends the week trying to base around its 50 day moving average while defense and energy hold their relative strength. Confirm with a VIX that drifts back toward the high teens and stable 10 year yields. Invalidate with a CPI surprise in either direction.
Upside case: CPI cool, growth bounces. A softer than expected core CPI print and constructive Oracle guidance can spark a sharp short covering bounce in semis and software. Confirm with semiconductor leadership, a VIX move back under 18, and yields drifting lower. Invalidate with rejection at last week's high or hawkish ECB language.
Downside case: second leg lower. A hot CPI plus weak Oracle guidance plus escalation in the Gulf would force another wave of selling, especially in the Nasdaq 100. Confirm with the index breaking last Friday's low on volume, VIX above 25, and broad participation in the decline (small caps, semis, software all weak together). Invalidate with strong reversal candles on lighter volume.
What traders should watch next
- Tuesday, June 10: May CPI and core CPI release. Oracle (ORCL) and Chewy (CHWY) earnings after the close.
- Wednesday, June 11: ECB rate decision and press conference. May PPI and core PPI in the morning. Adobe (ADBE) and Lennar (LEN) report.
- Thursday, June 12: University of Michigan preliminary June consumer sentiment.
- All week: Iran war headlines, oil and Brent prices, and any sign of disruption in the Strait of Hormuz.
- Sector watch: XAR/ITA for defense, XLE/XOP for energy producers, SOXX for semis, IWM for small caps, KRE for regional banks if credit fear flares.
From our trading desk
In our internal logs at chartdojo.io, the traders who survived weeks like the one ahead were the ones with rule based plans for what to do in each scenario, not the ones with the strongest opinion. When CPI prints and the tape moves three points in a minute, the difference between a profitable day and a destroyed account is how fast a trader can execute a plan they already rehearsed.
FAQ
Why are defense stocks rallying when the broader market is falling? Defense names benefit directly from elevated geopolitical risk and rising US defense spending. Lockheed Martin, RTX, and Northrop Grumman all have visible order book growth tied to current operations in the Middle East. Their cash flows are less rate sensitive than mega cap tech, which makes them attractive when yields rise and growth multiples compress.
Is the Nasdaq selloff over? No one can know that in advance. Historically, 4 to 5% one week drops in the Nasdaq are followed by either a sharp bounce within two weeks or a second leg lower over the following month, depending on the macro path. This week's CPI print and Oracle guidance will likely decide which path the market takes.
How to use this in your trading practice
Setups like this week, with two big macro prints and two big earnings reports stacked on top of geopolitical risk, are the exact scenarios that punish improvisation and reward disciplined practice. ChartDojo lets you replay the next CPI reaction, the next ECB headline, and the next earnings gap as many times as you need, with AI-powered feedback on every entry, exit, and risk decision. Build real skills, not bad habits, with a free trial at https://chartdojo.io/register.
Sources
- Charles Schwab. Weekly Trader's Outlook
- IG International. Weekly Market Navigator, June 8 2026
- Alpha Spread. Defense Stocks Rally After US Israel Iran Strikes
- Al Jazeera. US and Israeli Military Companies Profiting from the Iran War
- ChartDojo Blog. Iran War 100 Days and Friday's Nasdaq Rout
- ChartDojo Blog. Hot Jobs Report Sends Nasdaq Down 5%
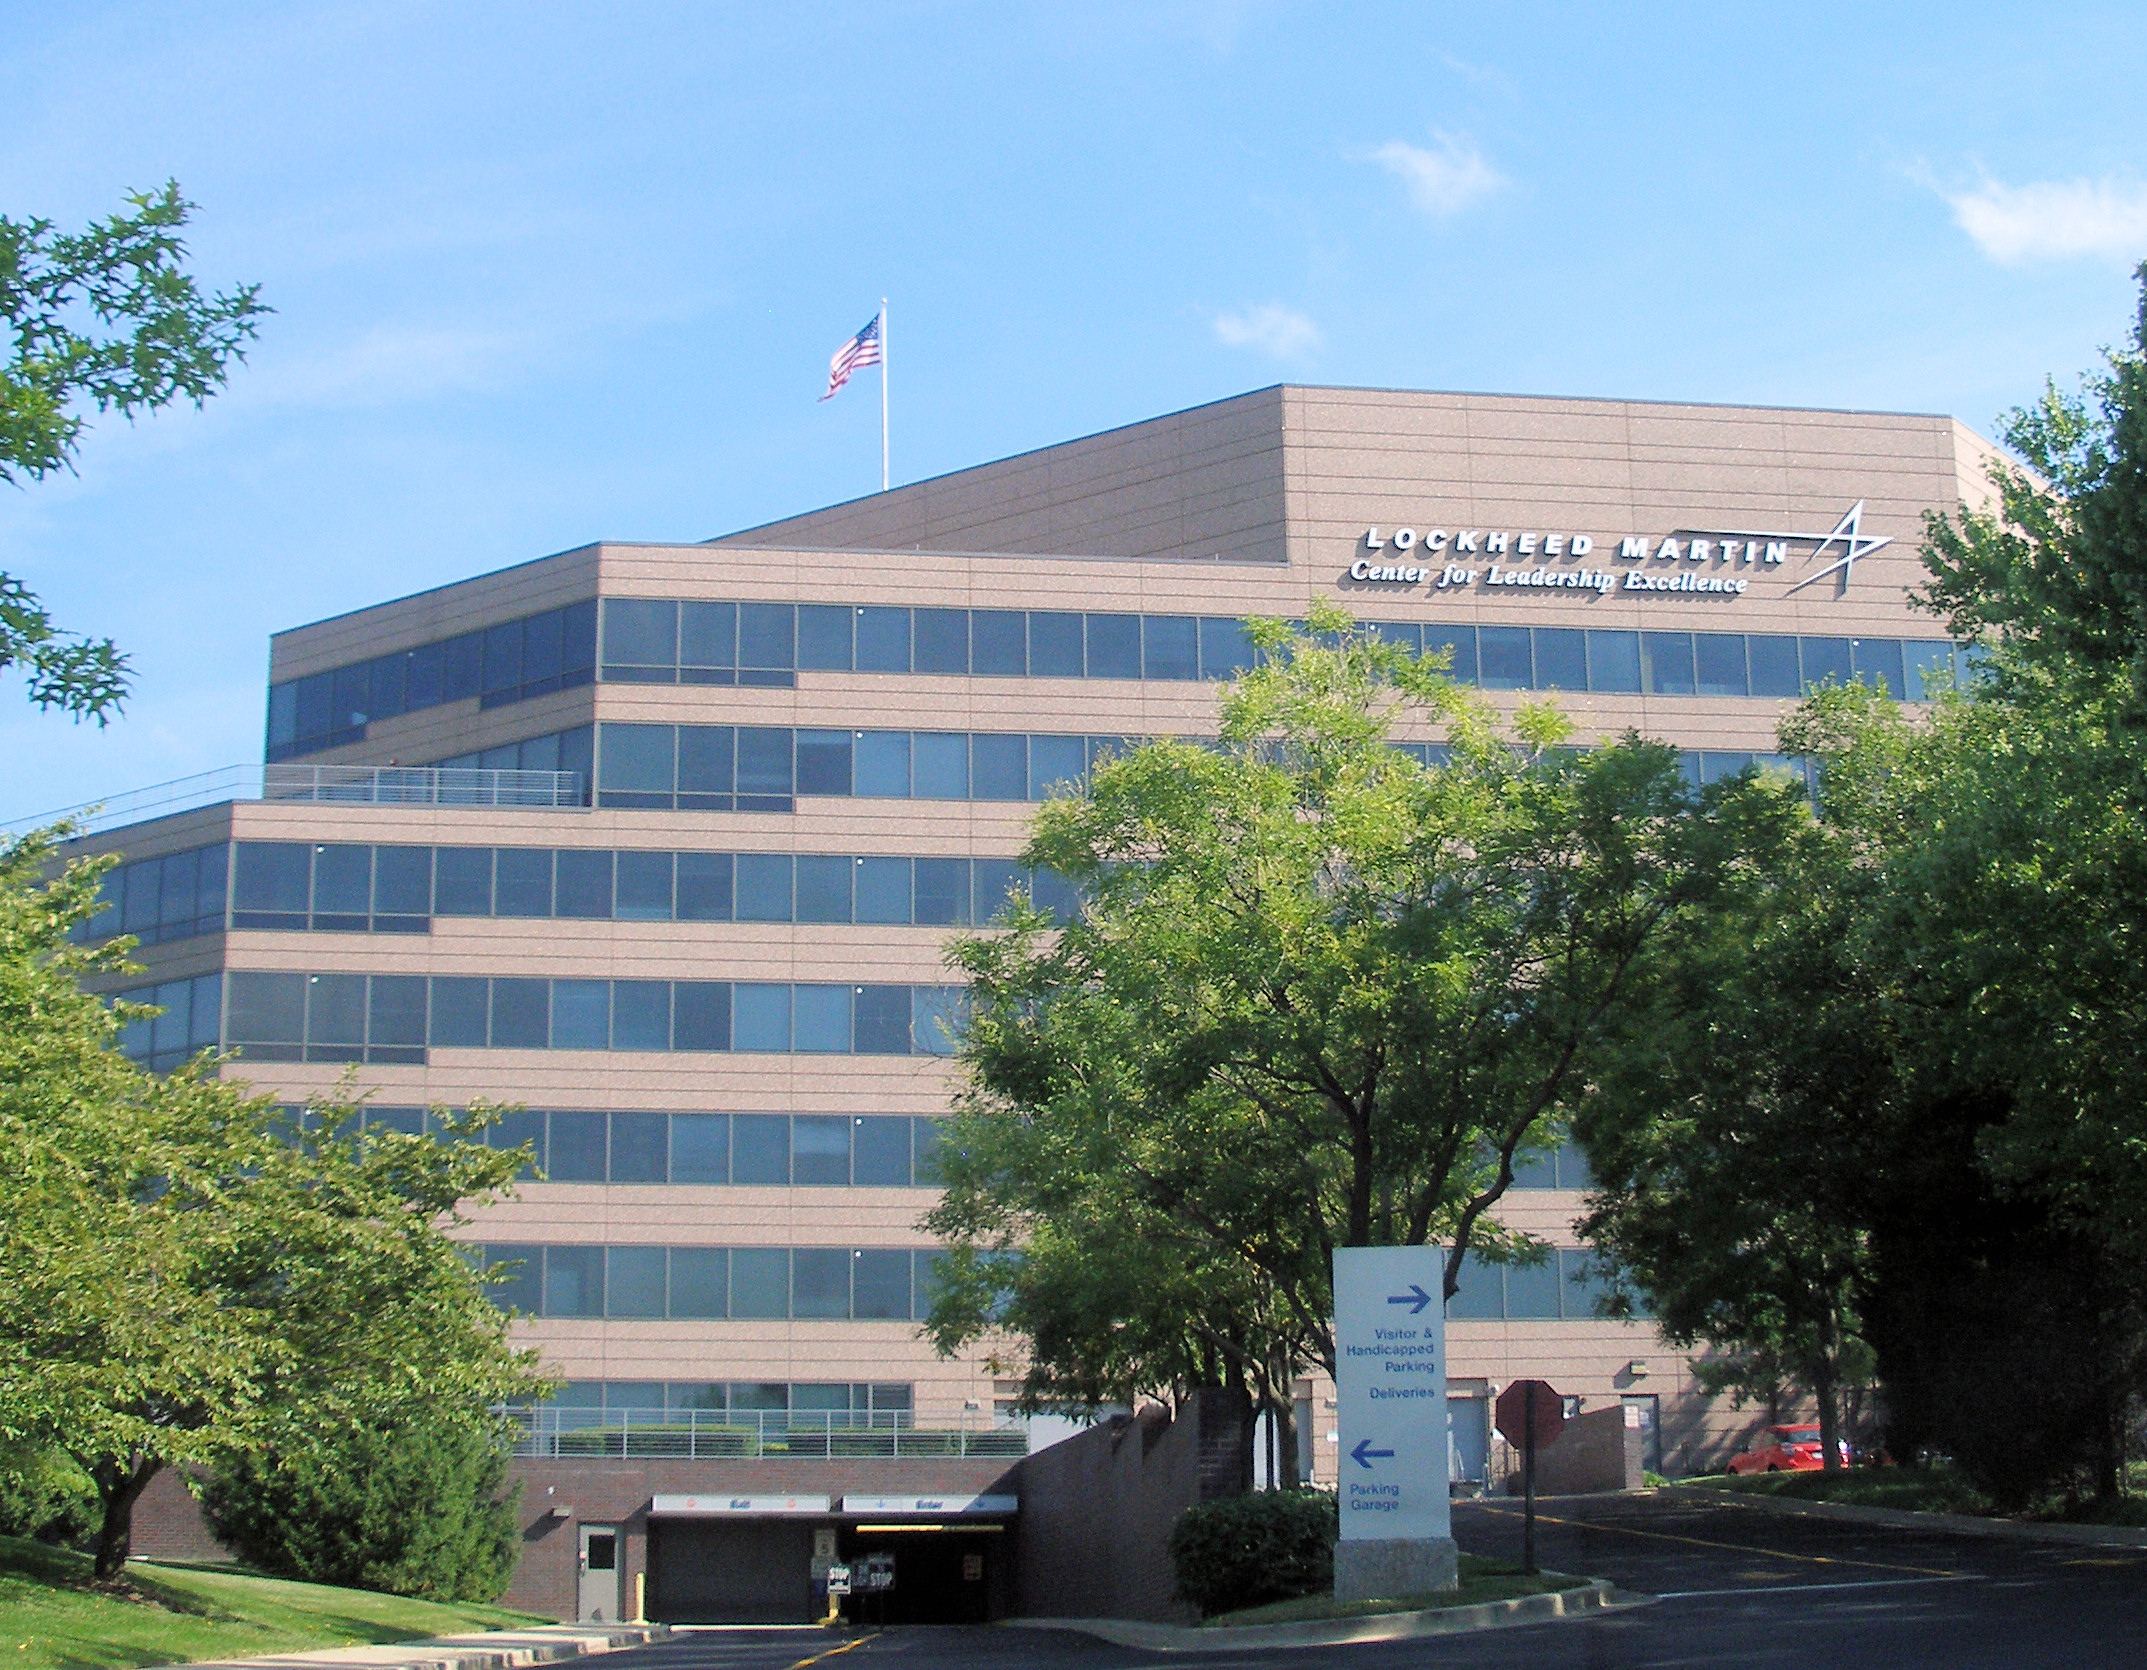
- Feature image: Lockheed Martin headquarters, by Coolcaesar, Wikimedia Commons (CC BY-SA 3.0)

Educational content only, not financial advice.
Header image source: Lockheed Martin headquarters, by Coolcaesar, Wikimedia Commons (CC BY-SA 3.0).