
TL;DR
- S&P 500 fell 1.24% to 7,408.50; Nasdaq dropped 1.54% to 26,225.14; Dow also down more than 1%
- 30-year Treasury yield topped 5.1% and 10-year reached 4.595%, both near year highs
- Drivers: hot April CPI (3.8%), PPI (6%), Iran war oil surge (WTI $104, Brent $108), new Fed Chair Kevin Warsh uncertainty, Trump-Xi summit disappoints
- Bitcoin slipped to the $81,000-$82,000 range as risk appetite contracted
What Happened
US markets closed sharply lower on Friday, May 15. The S&P 500 shed 1.24% to finish at 7,408.50. The Nasdaq Composite fell 1.54% to 26,225.14. The Dow Jones Industrial Average also dropped more than 1%. The selloff unwound a stretch of record highs that had carried equities higher through late April and early May.
Treasury markets were the center of attention. The yield on the 30-year bond jumped nearly 11 basis points to 5.121%, its highest since May 2025 and approaching levels last seen in October 2023. The benchmark 10-year note surged 14 basis points to 4.595%. Even the 2-year note, which tends to track near-term Fed policy expectations, climbed 9 basis points to 4.079%. One basis point equals 0.01%; yields move inversely to bond prices, so rising yields mean falling bond values.
Oil added to the pressure. West Texas Intermediate (WTI), the US benchmark crude, rose $3.22 to $104.39 a barrel. Brent crude, the global benchmark, climbed $2.58 to $108.30. Energy prices have remained elevated throughout 2026 due to the ongoing conflict in the Middle East and disruptions in the Strait of Hormuz shipping corridor.
Treasury Yields Surge on Inflation and Rate Fears
The yield spike reflected a convergence of four distinct pressures, each reinforcing the others.
Inflation data ran hot all week. The Consumer Price Index (CPI) for April came in at 3.8% year-over-year, its highest reading since May 2023. Producer prices (PPI), which measure wholesale costs and signal future consumer price pressures, rose at a 6% annual rate, the highest since late 2022. Import prices jumped 1.9% for the month of April alone and 4.2% on a 12-month basis, driven largely by energy costs. Export prices also surged 8.8% annually, a level not seen since late 2022.
Kevin Warsh was confirmed as Federal Reserve Chair this week. The Senate confirmed Warsh on Wednesday, May 13, replacing Jerome Powell. Warsh has pledged to remake the central bank and has a hawkish reputation on inflation. While he has previously floated the idea of rate cuts, the current inflation environment makes that path difficult. Markets are now pricing a meaningful probability of a rate hike later this year rather than the cuts that had been expected earlier in 2026. That shift in rate expectations pushed long-end yields higher.
The Trump-Xi Beijing summit produced no major breakthroughs. Trump met Xi Jinping in Beijing on Thursday and Friday. Despite Trump calling the talks fantastic and claiming many problems were resolved, no concrete trade agreements were announced before he departed. That outcome disappointed markets that had priced in some potential for trade relief, and it contributed to fresh oil price gains as geopolitical risk premiums were rebuilt.
Iran war energy shock continues. The ongoing conflict in the Middle East and Strait of Hormuz disruptions have kept oil elevated throughout 2026. Each lack of resolution keeps energy costs high, which feeds directly into inflation and sustains upward pressure on yields. As one market analyst noted Friday: "Long end rates are now in control of monetary policy."
Implications for Traders
Equity traders face a shift in the risk-reward calculus. With 30-year yields above 5% and 10-year yields near 4.6%, Treasuries now offer a competitive return relative to equities without volatility risk. The so-called equity risk premium, the extra return investors demand for owning stocks versus bonds, has compressed. Tech and growth stocks, which are most sensitive to discount rates, led Friday's declines.
Futures traders saw the move across commodity, equity index, and rates contracts. WTI and Brent crude futures remained well above $100. E-mini S&P 500 futures had signaled weakness before Friday's open, with futures down more than 1% overnight. Rates futures shifted sharply toward pricing a Fed rate hike by year-end, reversing the cut expectations that had supported stocks through the spring.
Crypto traders were caught in the crossfire. Bitcoin slipped back toward the $81,000-$82,000 range after briefly rallying to $82,000 earlier in the week on optimism about the CLARITY Act, new US crypto regulatory legislation that has gained bipartisan momentum. Higher long-term yields reduce the relative appeal of risk assets like Bitcoin, particularly when the AI trade is absorbing much of the speculative risk appetite.
Potential Positives vs Negatives
Potential positives:
- The inflation data, while hot, reflects an economy still generating activity. Nominal growth has remained resilient, which limits downside risk for corporate earnings.
- Kevin Warsh is well-respected on Wall Street and has institutional credibility. If he can anchor inflation expectations without triggering a recession, that is a positive longer-term outcome for markets.
- The CLARITY Act regulatory progress for crypto is a genuine structural tailwind that does not disappear because of a rates move.
- The Trump-Xi visit reportedly cleared Nvidia H200 AI chip sales to major Chinese technology firms, a potential positive for semiconductor and AI stocks that could offset some of the macro headwinds.
Potential negatives:
- If CPI stays above 3.5% and oil remains above $100, the Fed will face sustained pressure to hike rates. A rate hike cycle would be a meaningful headwind for equities priced for a benign rate environment.
- The 30-year yield above 5% raises the cost of long-duration borrowing. Mortgage rates, auto loans, and corporate bond refinancing costs will all rise, eventually weighing on growth.
- The Iran war remains unresolved. Any escalation in the Strait of Hormuz could push oil sharply higher in a way that markets have not fully priced.
- The Trump-Xi summit's lack of clear outcomes leaves US-China trade uncertainty unresolved, which may continue to weigh on supply chain costs and corporate planning.
What Could Happen From Here
Base scenario (most likely): Yields stabilize in the 4.4%-4.6% range on the 10-year as the market digests the week's data and waits for May inflation prints. Stocks chop sideways to slightly lower. Oil holds above $100 but does not spike sharply. Bitcoin stays in the $80,000-$85,000 range as regulatory momentum provides a floor while rates headwinds cap upside. Confirms: stable or declining weekly inflation data; no Hormuz escalation. Invalidates: another round of hot data or a fresh oil supply shock.
Upside scenario: Warsh signals in early public remarks that the Fed will not hike preemptively. Oil pulls back toward $95-$98 on a geopolitical de-escalation signal. Risk appetite rebounds. Nasdaq recovers toward record highs. Bitcoin tests $85,000-$88,000. Confirms: Warsh dovish signal; Brent falls below $100; next CPI print below 3.5%. Invalidates: Warsh hawkish remarks; oil surges; CPI stays above 3.8%.
Downside scenario: The May CPI print comes in at or above 3.8% again. Warsh signals the Fed will consider hiking at the June or July FOMC meeting. Treasury yields push higher with the 10-year toward 5% and the 30-year toward 5.5%. Equities enter a sharper correction of 5%-10% from current levels. Bitcoin breaks below $78,000. Oil above $110 would amplify all of these moves. Confirms: hot May CPI; explicit Fed rate hike language; Brent above $110. Invalidates: inflation data cools; ceasefire or Hormuz resolution; Warsh explicitly rules out a near-term hike.
What to Watch Next (Next 24-48 Hours)
- Kevin Warsh's first public remarks as Fed Chair: any signal on the rate path will move markets immediately.
- Oil prices over the weekend: any Middle East developments affecting Hormuz traffic or Iran-related supply will be reflected in Monday's open.
- Nvidia earnings (next Wednesday): the AI sector has been a key support for tech; any guidance weakness could amplify the ongoing rate-driven tech selloff.
- Bitcoin weekend price action: crypto markets trade 24/7. A break below $80,000 on low-liquidity weekend trading would be a technically significant development.
- US fiscal policy signals: ongoing concerns about deficits and bond supply continue to keep upward pressure on long-end yields. Any signals from Congress on spending trajectory matter.
FAQ
Why do rising Treasury yields hurt stocks?
When Treasury yields rise, bonds become more competitive with stocks on a risk-adjusted basis. Investors can earn 4.6% holding a 10-year Treasury with no credit risk, which raises the bar for what equities need to deliver. This weighs most on growth and tech stocks, which rely on future earnings discounted at today's rates. Higher rates make those future earnings worth less in present value terms.
What does Kevin Warsh's confirmation mean for rates?
Warsh was confirmed as the new Federal Reserve Chair on Wednesday. He has a reputation as a hawkish inflation-fighter and has pledged to prioritize price stability. With CPI at 3.8% and PPI at 6%, he inherits a difficult inflation problem. Markets are now pricing meaningful odds of a rate hike later in 2026 rather than the cuts previously expected.
Sources
- CNBC: 30-year Treasury yield tops 5.1%, highest in nearly a year
- CNBC: S&P 500 shed 1.24%, Nasdaq slipped 1.54% on May 15
- Bloomberg: US 10-year Treasury yield hits highest since July after PPI data
- New York Times: Trump-Xi summit live updates
- Motley Fool: Kevin Warsh is the new Fed Chair and rates may not drop this year
For more context on the oil and energy dynamics driving the inflation picture, see our earlier coverage: Brent Crude Settles at $109 as Trump Signals He Is Losing Patience With Iran.
Markets are growing more complex by the week. Understanding why yields move, how oil feeds inflation, and how rate shifts cascade into equities and crypto takes real analytical skill. At ChartDojo, you build those skills through AI-powered feedback on every trade decision you make. Build real skills, not bad habits. Try ChartDojo free and sharpen your edge before the next volatility wave hits.
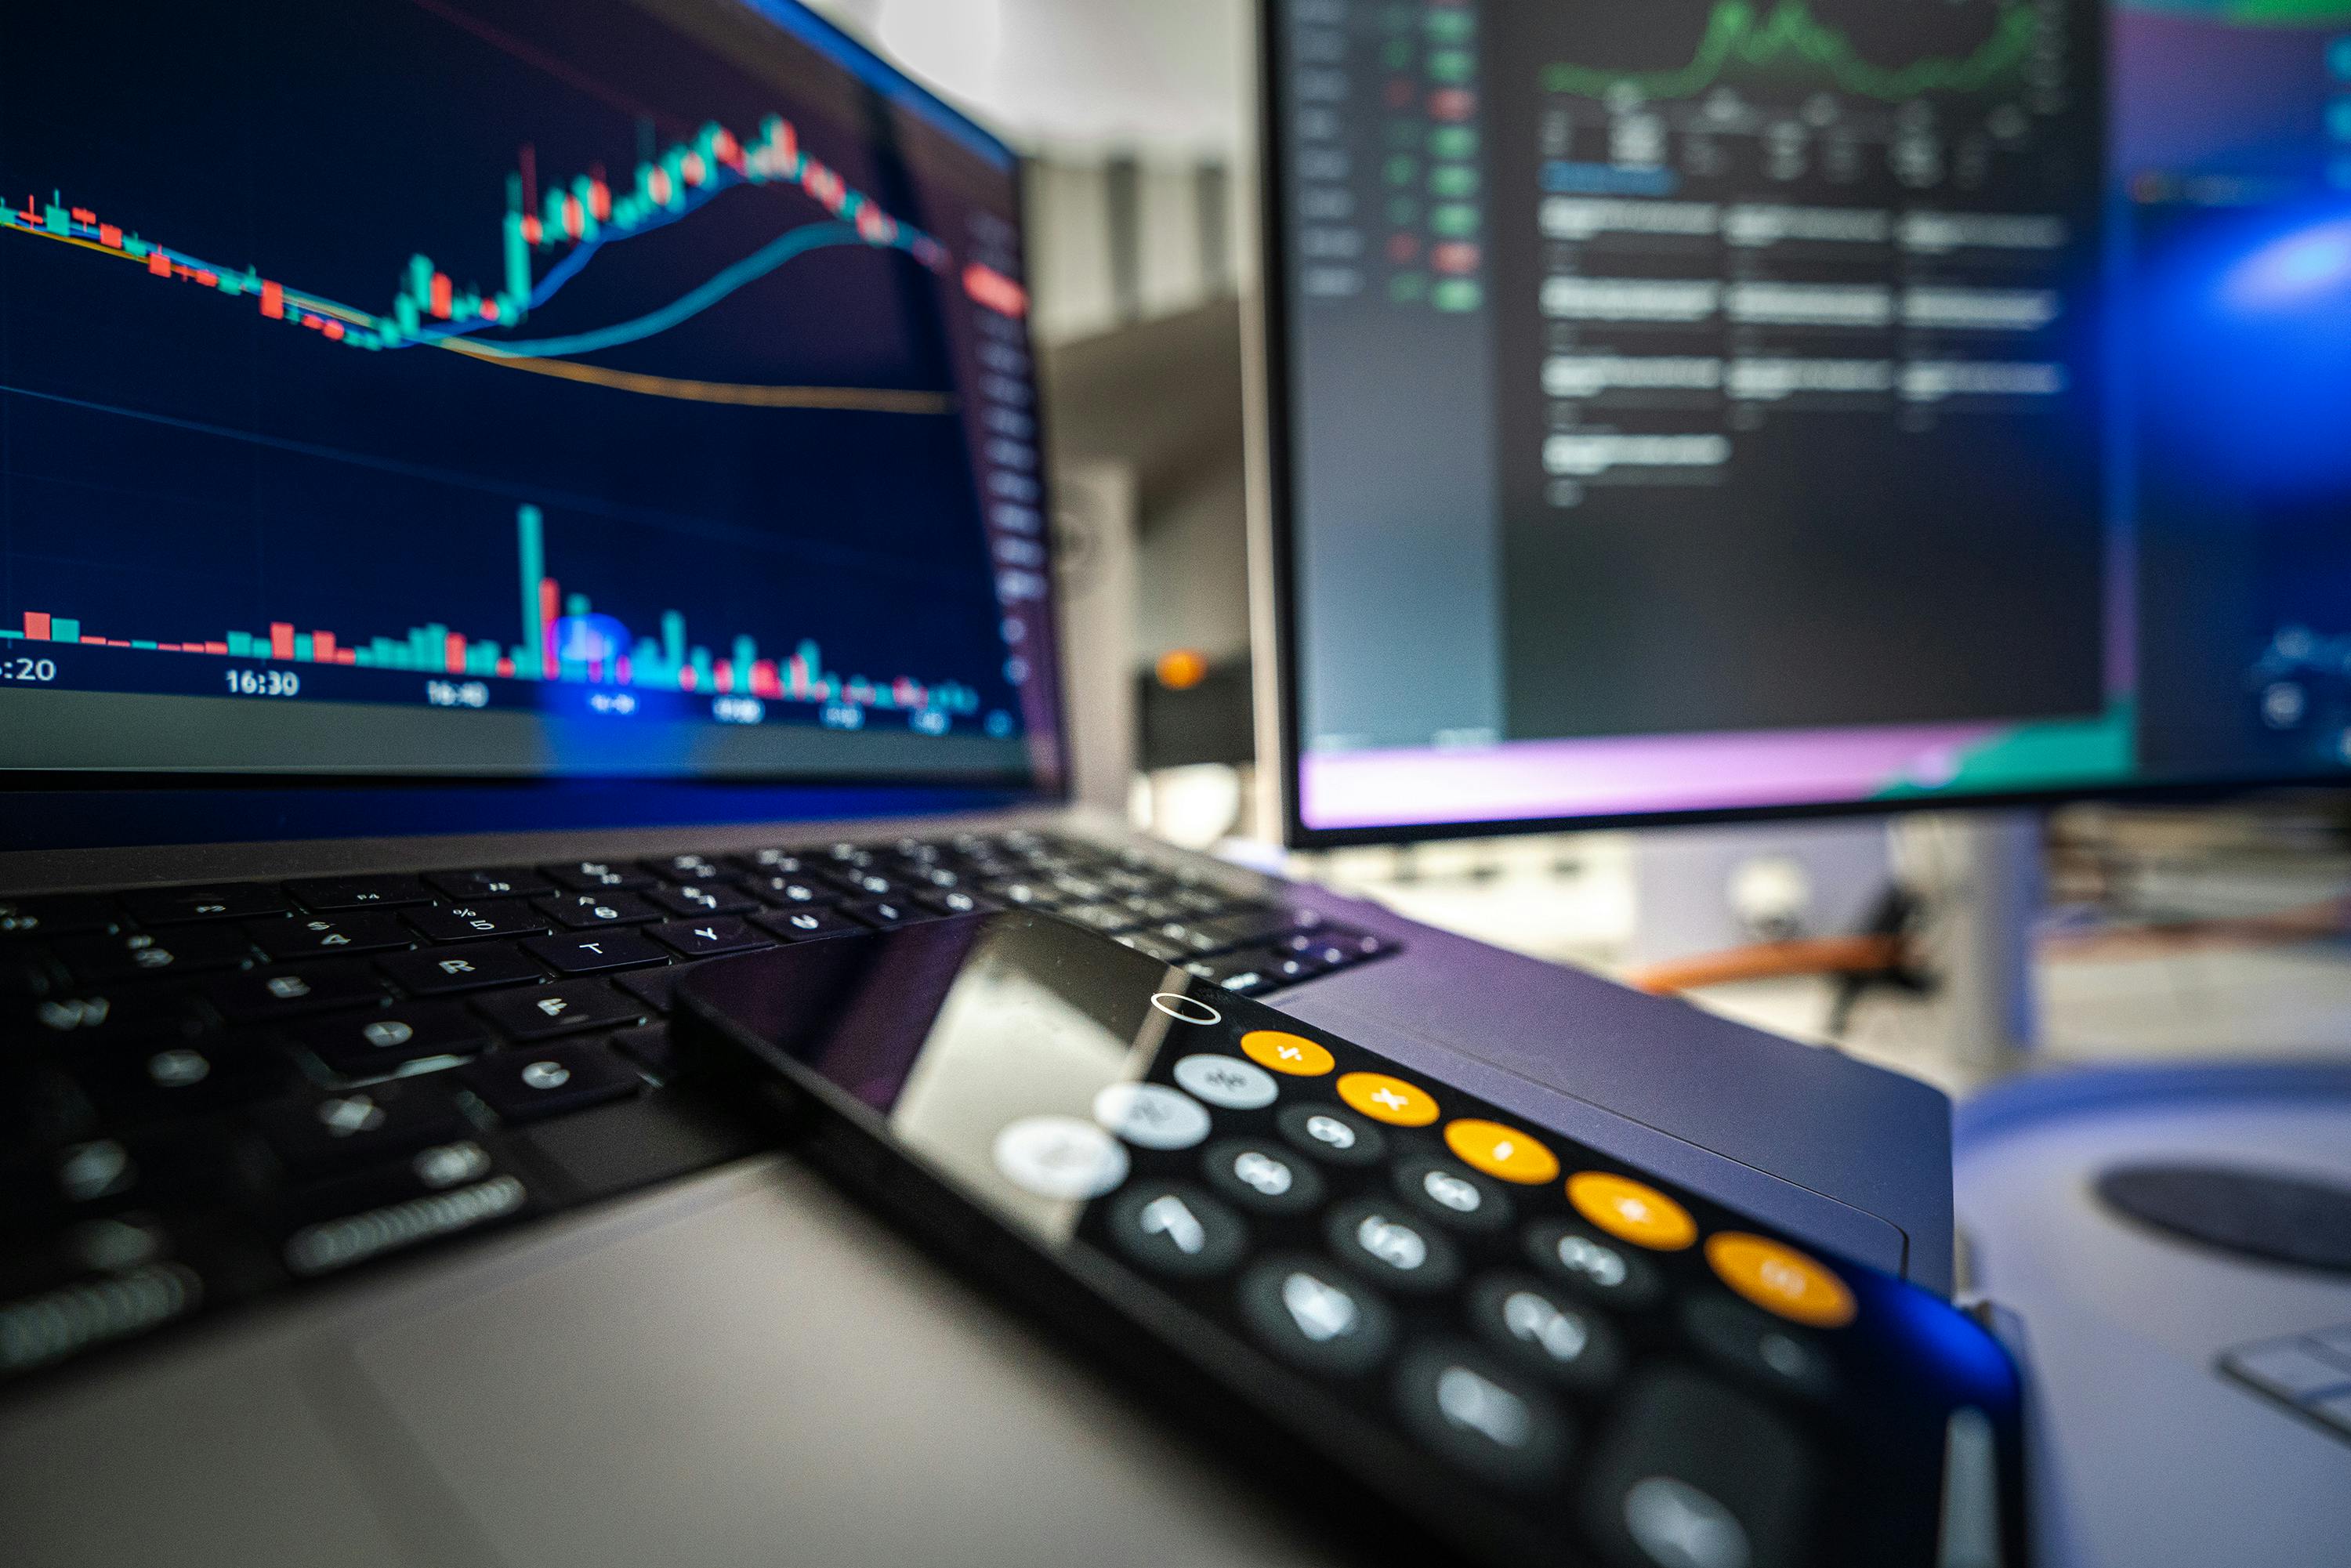
Header image source: pexels by Rene Terp. License: PEXELS.