
TL;DR
- Iran fired seven ballistic missiles at Kuwait and Bahrain on Saturday, June 6, 2026. CENTCOM intercepted six; one struck near a Kuwaiti military installation, killing one person and injuring 32.
- U.S. forces retaliated by striking Iranian radar stations at Goruk and on Qeshm Island. Iran threatened full Strait of Hormuz closure if attacks continue.
- The escalation compounds Friday's major equity selloff: the Nasdaq fell 4.18% (worst session since April 2025), the S&P 500 dropped 2.64%, and semiconductor stocks lost more than $1 trillion in market value in a single session.
- WTI crude holds near $93 per barrel; Brent near $95. Sunday's oil futures open at 6 p.m. ET will be the first real-time price signal.
- Bitcoin is at a four-month low near $62,000 after a record 13-session ETF outflow streak drained $4.4 billion from U.S. spot funds.
What Happened
On Saturday morning, June 6, 2026, Iran launched seven ballistic missiles toward Kuwait and Bahrain. U.S. Central Command (CENTCOM) confirmed that six were intercepted by air-defense systems. One missile struck near a Kuwaiti military site; authorities confirmed one fatality and 32 injuries. Kuwait's government condemned the attacks as a “direct threat to the lives of citizens and residents” and called them a “dangerous escalation.” CENTCOM responded by striking Iranian radar installations at Goruk and on Qeshm Island in the Persian Gulf. Iran then warned that any further aggression would result in full closure of the Strait of Hormuz, through which roughly 20% of global traded oil passes each day.
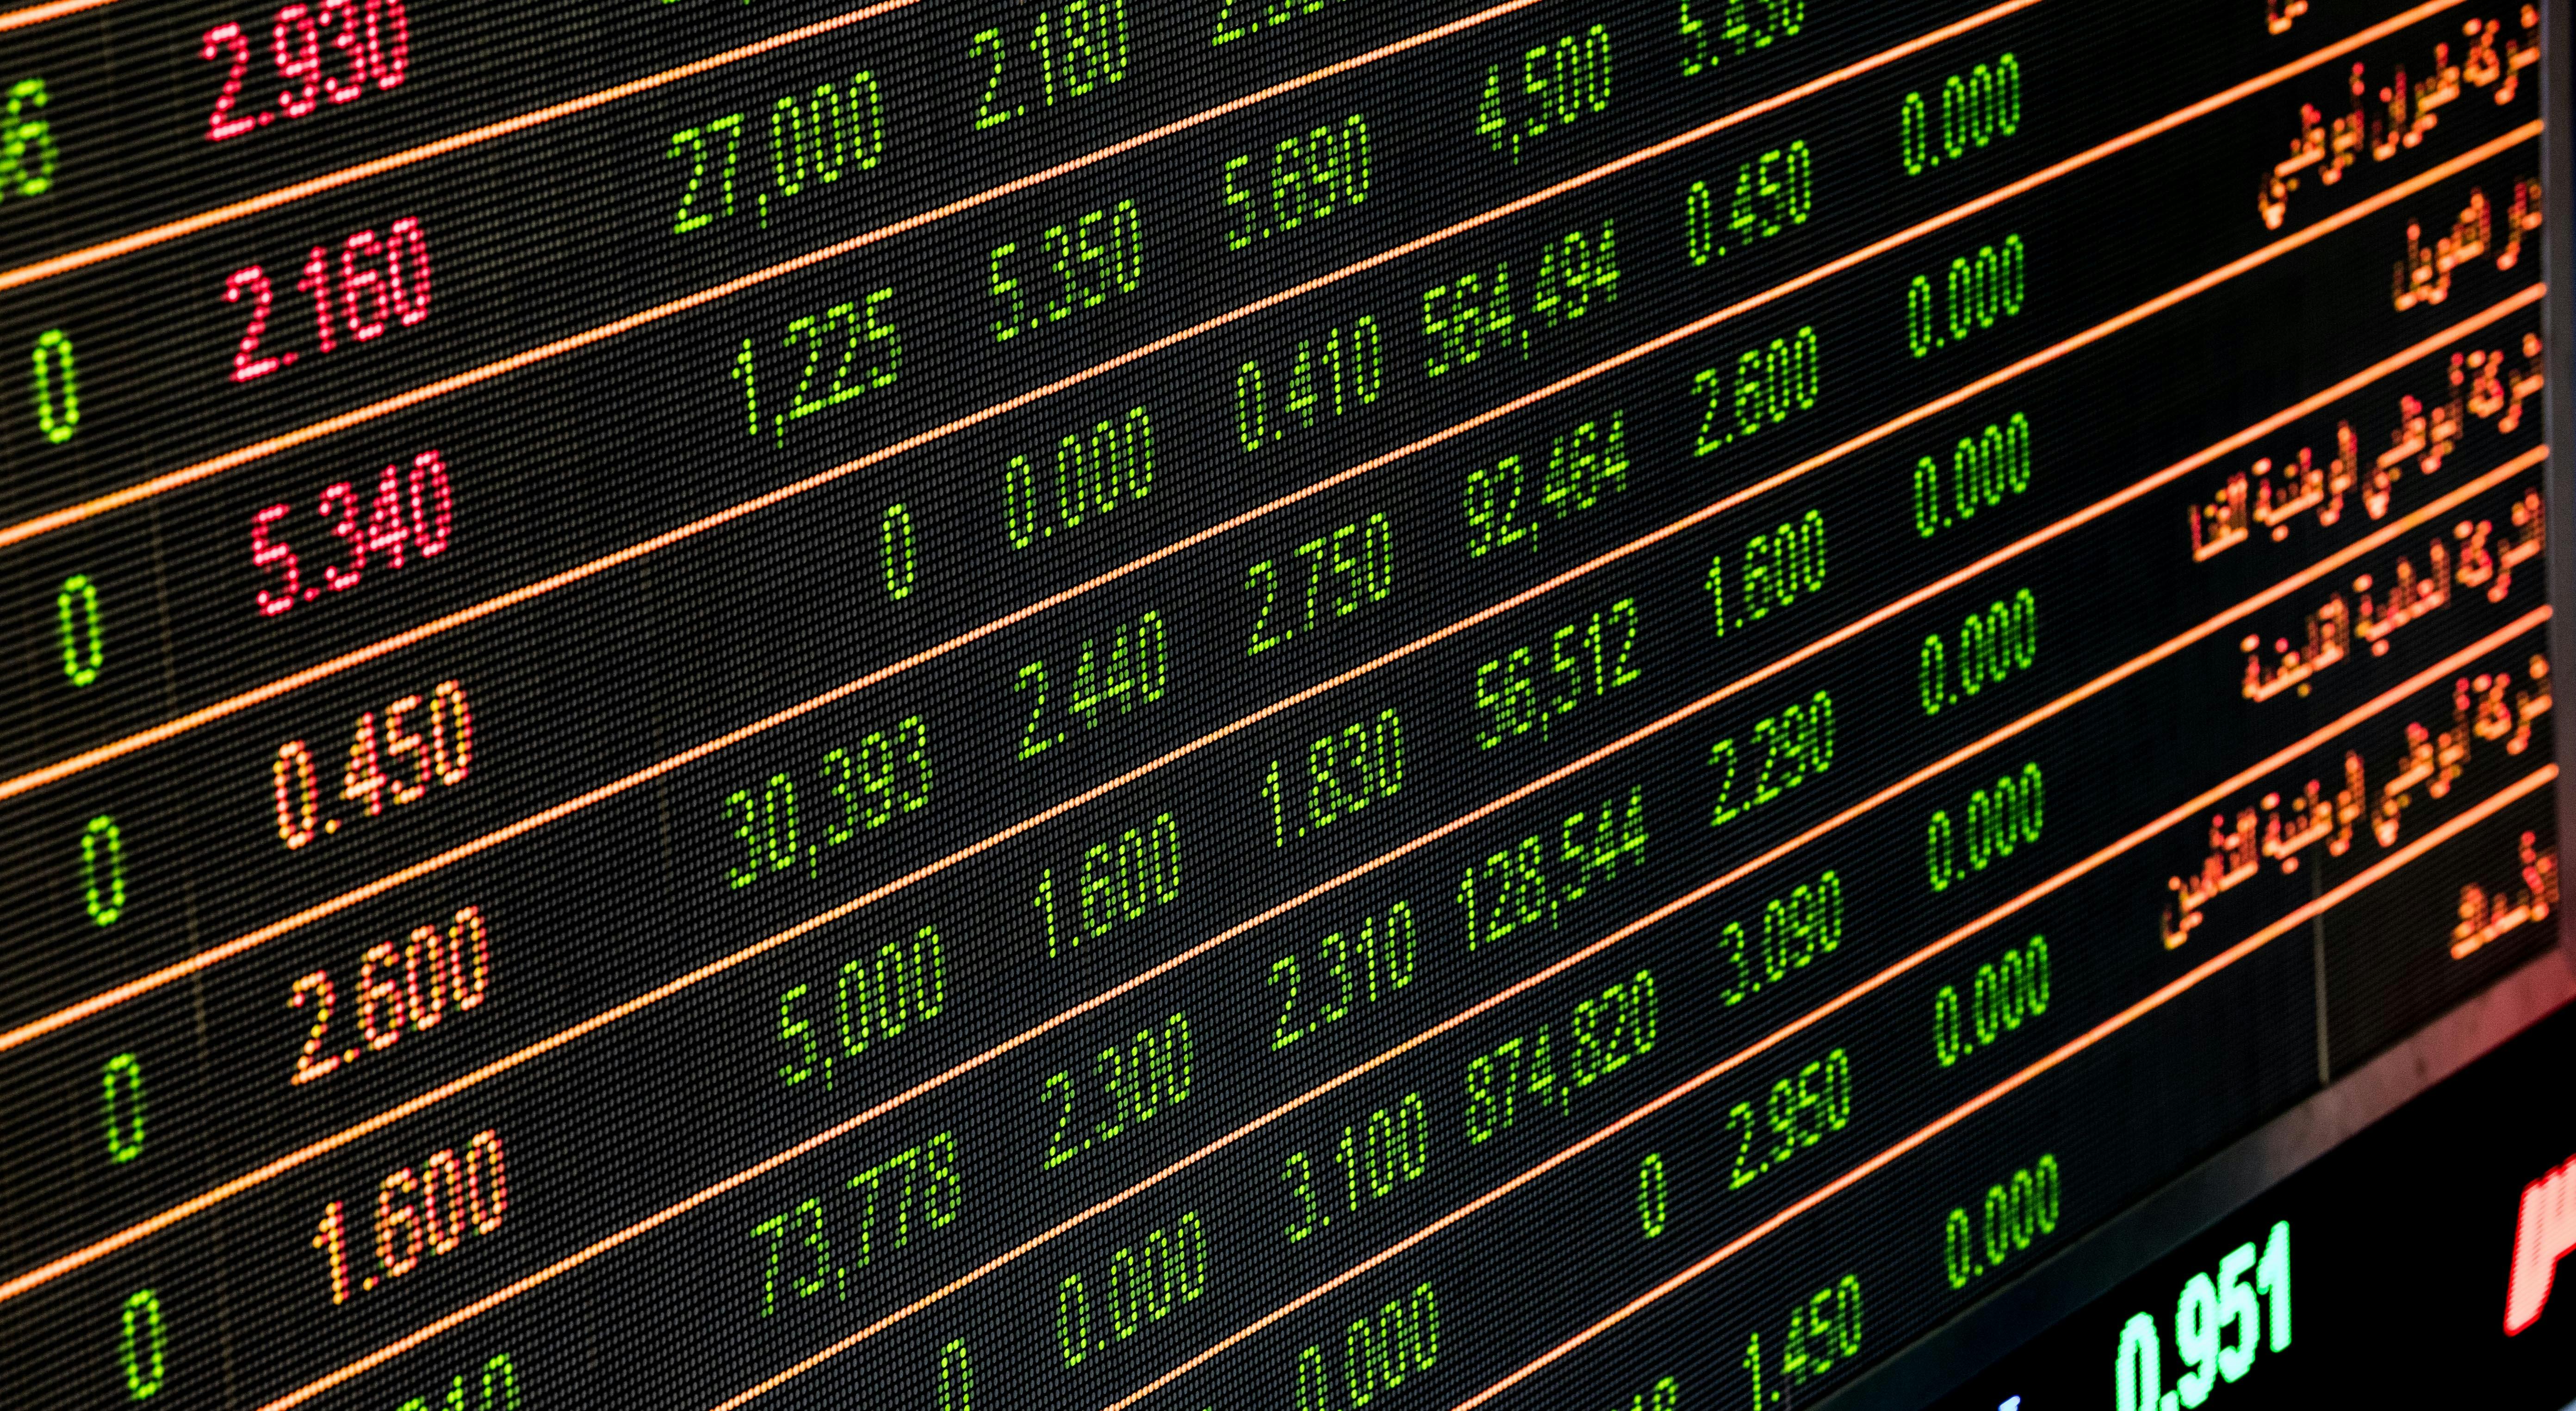
These events land on a market already under significant pressure from Friday's selloff. On June 5, the Nasdaq Composite fell 4.18% to 25,709, its worst single session since April 2025, after Broadcom (AVGO) held its full-year AI chip targets unchanged. Investors had priced in an upward revision after a 31% Nasdaq rally from March lows. AMD fell 10.86%, Intel dropped 11.28%, Nvidia lost roughly 6%, and the VanEck Semiconductor ETF (SMH) declined nearly 10%, erasing more than $1 trillion in sector market value. A stronger-than-expected May jobs report compounded the damage: nonfarm payrolls added 172,000 positions, unemployment held at 4.3%, and the 10-year Treasury yield surged from 4.47% to 4.55%. Gold futures fell 3.1% to $4,365 per ounce as the dollar rose 0.6%, a pattern consistent with rate-driven selling rather than a traditional flight to safety.
In crypto, Bitcoin slid to approximately $62,000, a four-month low. Ethereum fell near $1,676. U.S.-listed spot Bitcoin ETFs completed 13 consecutive sessions of net outflows from May 15 through June 3, draining $4.4 billion and pushing 2026's cumulative ETF flows into negative territory for the first time since launch.
Iran Ballistic Missile Strike on Kuwait: Why These Markets Are Moving
Ballistic missiles against a Gulf ally raise the conflict threshold. Ballistic missiles landing on two Gulf Cooperation Council member states and prompting direct U.S. counterstrikes on Iranian territory represent a sharp escalation beyond the drone exchanges that defined earlier weeks of the 2026 conflict. A credible Hormuz restriction would affect roughly 20 million barrels per day of global oil supply within hours of any announcement, with no short-term alternative shipping route available at that scale.
Rate repricing hits stretched semiconductor valuations. Friday's jobs data sharply reduced expectations for Federal Reserve rate cuts in 2026. An 8 basis-point rise in the 10-year yield in a single session is a direct headwind for growth stocks, particularly semiconductors that had rallied sharply from March lows without a meaningful pullback to absorb the gains.
Broadcom's guidance questioned the AI chip growth narrative. Unchanged annual guidance suggested the AI-infrastructure spending boom may be plateauing at current levels rather than accelerating. That narrative had carried Nvidia, AMD, Intel, and the broader Magnificent Seven through May. With the thesis now in question and the sector extended, the exit from chip stocks was fast and broad.
Crypto lost its main legislative catalyst. The Clarity Act market-structure bill for crypto is losing momentum in Congress as lawmakers remain divided on key provisions. Combined with Mt. Gox creditor transfers adding incremental supply pressure and the record ETF outflow streak, institutional flows have shifted from accumulation to distribution.
Implications for the Most Impacted Trader Cohorts
Equities and index futures. The S&P 500 closed at 7,383 and the Nasdaq at 25,709 heading into the weekend. Any further Iran escalation over Saturday and Sunday could extend Friday's losses into Monday's open. At ChartDojo, our analysis of user trading patterns during comparable macro-shock sessions shows that position sizing under elevated volatility is where traders give up the most ground. The platform identifies this directly in post-trade reviews. Reducing size until a new trading range forms is the disciplined response in sessions like these.
Oil and energy futures. WTI at $93 and Brent at $95 carry clear upside risk if Sunday's futures open prices in credible Hormuz disruption. A Brent move above $96 to $97 on Sunday would signal traders are treating the closure threat seriously. Natural gas futures are also exposed if Gulf LNG export operations face disruption from the ongoing conflict.
Crypto traders. The 13-session, $4.4 billion ETF outflow streak reflects institutional reallocation, not ordinary price noise. Without a Clarity Act legislative catalyst or a Fed pivot signal, both Bitcoin below $62,000 and Ethereum near $1,676 face continued pressure into the week. The Mt. Gox transfer overhang adds incremental selling risk at current price levels.
Potential Positives vs Negatives
Upside drivers: A credible ceasefire signal or backchannel U.S.-Iran diplomatic contact would remove the geopolitical premium from oil and likely trigger a risk-asset recovery. A Fed signal of tolerance for the current employment environment, without reopening rate-hike language, could stabilize growth-stock valuations. Broadcom's guidance was a disappointment but not a formal downgrade; a consolidation week could reset semiconductor valuations to more attractive tactical entry levels for buyers with a longer horizon.
Downside risks: Iranian restrictions on Hormuz transit would be a systemic oil-supply shock with cascading effects on energy prices, inflation expectations, and broader equity valuations. A 10-year Treasury yield sustained above 4.65% would add a second headwind to equities on top of the geopolitical uncertainty. A 14th consecutive Bitcoin ETF outflow day would mark a new record for institutional selling pressure on the complex and likely deepen the bearish sentiment in crypto further.
What Could Happen From Here
Base case (50%): Escalation over the weekend falls short of Hormuz closure. Oil gaps higher Sunday evening and stabilizes. Equity futures open 0.5 to 1% lower Monday before recovering through the session. Bitcoin holds the $60,000 to $62,000 range. Semiconductor stocks begin a choppy recovery as the AI demand narrative is debated but not abandoned. Confirmed by a WTI Sunday open below $95 and no new major strikes or Hormuz restrictions. Invalidated by Iran announcing transit restrictions or fresh attacks on Gulf energy infrastructure.
Upside case (25%): Backchannel U.S.-Iran communication emerges over the weekend. Oil gives back gains. Risk assets rally Monday on short-covering; Bitcoin recovers toward $65,000. Confirmed by Reuters or AP reporting indirect diplomatic contact and WTI below $90 on Sunday. Invalidated by fresh Iranian attacks within 24 hours.
Downside case (25%): Iran announces Hormuz transit restrictions or attacks additional Gulf energy infrastructure. Brent spikes above $100. U.S. equity futures fall 2% or more Sunday night. Bitcoin falls below $60,000. Confirmed by Iranian state media announcing Hormuz closure and tanker operators announcing route diversions around the strait. Invalidated by IRGC signaling restraint or the Iranian Foreign Ministry announcing diplomatic contact.
What to Watch Next (Next 24 Hours)
- Sunday oil futures open (~6 p.m. ET): The first real-time market vote on Hormuz risk. WTI and Brent movement above or below 1% will set the tone for Monday's equity and energy trading.
- CENTCOM and Pentagon statements: New updates on Iranian activity near the strait or additional counterstrikes will move oil futures within minutes of release.
- Kuwait and Bahrain government responses: Invocation of GCC collective security provisions would signal the conflict is harder to contain diplomatically.
- Nasdaq and S&P 500 futures Sunday evening: The S&P 500's 50-day moving average near 7,200 is the key technical level to watch. A break below it in futures would signal risk of continuation into Monday.
- Bitcoin ETF flow data: CoinGlass and The Block publish daily ETF flow data. A 14th straight outflow day would be a new institutional record and likely add downward pressure to BTC price.
Frequently Asked Questions
Why do Iranian ballistic missiles hitting Kuwait affect U.S. equity markets?
Kuwait and Bahrain both host significant U.S. military installations. Iranian ballistic missiles striking those locations draw the United States directly into a military exchange, raising the risk of broader conflict escalation. Markets reprice this risk through oil futures (Hormuz supply risk premium), Treasury yields (flight to safety), and equity volatility indices. The sequence is typically oil first, then equities, then crypto within 12 to 24 hours of a major geopolitical shock.
For prior coverage of Hormuz risk and energy market dynamics during the 2026 Iran conflict, see Iran Drones Threaten Strait of Hormuz: Oil Risk Watch. For the background on how the rate repricing environment has been pressuring U.S. equities, see US Stocks Risk Map: Nasdaq Correction and Fed Rate-Hike Repricing.
Sources
- Fox News Digital / CENTCOM (June 6, 2026): US strikes Iran radar sites after drones near Hormuz, missiles at Kuwait and Bahrain
- Gulf News (June 6, 2026): Iran launches seven ballistic missiles at Kuwait, Bahrain in sharp Gulf escalation
- The Hindu (June 6, 2026): West Asia war LIVE: Kuwait condemns Iran attacks as dangerous escalation
- Reuters (June 5, 2026): Wall Street ends sharply lower as chips slide, jobs data fuels rate hike fears
- CNBC (June 4-5, 2026): Nasdaq falls 4% and suffers worst day since April 2025 as traders flee chip stocks
Build Real Skills With ChartDojo
Market shocks like this week's Iran escalation and semiconductor selloff expose exactly where trader habits break down. Position sizing under volatility and reading catalysts without a clear framework are the two failure points that show up most in our review data. ChartDojo gives you AI-powered feedback on every trade you take, so you build real skills, not bad habits. Start your free trial at chartdojo.io/register.
Header image source: pexels by Pixabay. License: PEXELS.