
AMD's $1 trillion market cap milestone arrived during a broad semiconductor rally on September 21, 2026. CNBC reported that the shares reached $615.52 intraday, briefly taking the company's equity value above the threshold. Enthusiasm about Meta's Muse AI agent helped support chip stocks, while the Nasdaq Composite finished at a record.
For traders, the useful question is whether that strength persists across chip companies after the headline. A market-cap milestone describes the value investors assign to outstanding shares. It does not establish a new earnings forecast or an entry price.
Reporting checked after the 4 p.m. ET close on September 21, 2026. Prices below are attributed observations from September 21 reporting. The practice calculations are hypothetical. Educational analysis, not financial advice.
TL;DR
- AMD crossed $1 trillion in market value during Monday's session, according to CNBC and Reuters reporting.
- Bloomberg connected the semiconductor rally to enthusiasm about Meta's Muse agent and the computing demand such applications could generate.
- CNBC reported a 2.26% Nasdaq Composite gain and a record close of 27,122.09.
- A four-stock comparison worksheet below tests participation without treating a round valuation number as a trading signal.
What happened: AMD's $1 trillion market cap
CNBC's AMD report described a roughly 10% surge and an intraday high of $615.52. It also reported a five-session winning streak of about 25%. Reuters separately reported the first crossing of $1 trillion in market capitalization. These reports establish an intraday milestone; this article does not claim a verified closing market capitalization.
The rally extended beyond AMD. In its Monday closing report, CNBC said Intel rose 12% and Qualcomm gained 9%. The S&P 500 advanced 1.49%, compared with the Nasdaq Composite's 2.26% rise. Those figures describe different instruments, so a stock's gain should not be compared with an index-point change.
Market capitalization is share price multiplied by the relevant share count. It measures equity value, not cash on the balance sheet. A company can cross a round threshold without issuing guidance or announcing a customer order that day.
Why markets moved
Bloomberg's report on the chip rally connected the move to early signs of demand for Meta's Muse AI agent. That gives traders a specific hypothesis to examine: broader consumer use of software that performs tasks could require more computing capacity.
CNBC's Muse coverage cited Sensor Tower estimates of 730,000 downloads during roughly five days after the September 8 launch. The same report cautioned that competing apps had different platform-release schedules. Download comparisons therefore need that qualification.
Downloads also leave important commercial questions unanswered. Repeat usage and paid conversion determine whether initial interest becomes durable demand. Even successful adoption would not identify exactly how much incremental revenue reaches AMD. That depends on customer purchasing and the hardware used to serve the application.
Monday also brought lower crude prices and Treasury yields, according to CNBC. Our earlier oil-relief analysis covers that separate catalyst. The overlap limits any claim that one AI announcement caused the entire stock-market advance.
Implications for stock and futures traders
Single-stock traders face a concentrated question: can AMD retain strength relative to other chip names after a rapid five-session rise? A fresh headline may arrive after much of the repricing has occurred. Record the time it became available before labeling a later chart pattern a news response.
Index-futures traders need a wider comparison. The Nasdaq Composite is different from the Nasdaq-100 underlying NQ futures. Do not use the Composite's reported percentage change as an NQ return. Select the actual futures contract and use matching observation times.
A four-stock participation worksheet
This original practice exercise separates group participation from one headline stock. It is a proposed method, not a backtest or a claim about ChartDojo user results. Select AMD and Intel alongside Qualcomm and Meta. Meta represents the application-demand story; the other names offer a chip comparison.
- Choose one documented news timestamp. Save its source and use the last completed five-minute bar before it as the reference. If the price move began earlier, record that limitation.
- Record each stock's reference close and its close 30 minutes later. Calculate return as 100 multiplied by the later price divided by the reference price, minus 100.
- Measure the same interval for an appropriate benchmark. For index-futures practice, keep the contract month and price convention unchanged.
- Count positive stock returns, calculate their median, and subtract the benchmark return. Repeat on a separate interval without changing the original rules.
Consider hypothetical returns of AMD +4%, Intel +3%, Qualcomm +2%, and Meta +1%. Suppose the selected benchmark rises 0.8%. All four stocks advance. Their median return is 2.5%, leaving a 1.7-percentage-point difference from the benchmark. These are invented teaching inputs, not Monday's tape.
Now keep AMD at +4%, but change Intel to -1%, Qualcomm to -2%, and Meta to 0%. Only one stock advances. The median becomes -0.5%, which trails the same benchmark by 1.3 percentage points. AMD's identical gain conceals a different group outcome.
This difference is not beta-adjusted excess return and does not prove a common cause. Earnings or unrelated headlines can contaminate the comparison. Mark those intervals separately. The exercise grades whether the trader checked participation before acting. Our news-volatility practice guide explains how to preserve a decision rule before revealing later prices.
Potential positives vs negatives
On the positive side, advances across multiple chip companies offer more evidence of sector participation than AMD alone. Sustained consumer adoption of AI agents could also support additional computing demand, although the allocation across suppliers remains uncertain.
The downside is the distance between adoption expectations and realized earnings. Download rankings can fade. After a rapid rally, even decent operating news may disappoint elevated expectations. A concentrated position also remains exposed to company-specific execution risk.
What could happen from here
Base scenario: consolidation after the milestone
AMD holds part of its advance while chip stocks trade unevenly. Mixed participation in repeated, identical observation windows would support this scenario. A broad acceleration or widespread reversal would invalidate it.
Upside scenario: stronger participation
More chip names retain gains relative to the chosen benchmark, and subsequent company disclosures support additional demand. Improving participation plus verified commercial information would strengthen the case. Falling participation despite higher AMD prices would weaken it.
Downside scenario: expectations reverse
AMD gives back gains as the comparison group weakens or company news challenges demand assumptions. Broad deterioration would support this scenario. Renewed participation and credible operating evidence would invalidate it. These are conditional paths, not price targets.
What traders should watch next
At the next session, compare the opening range with Monday's late-session prices from the same data source. Watch whether strength extends beyond the largest movers. For NQ practice, separate overnight movement from the U.S. cash-session interval.
Check subsequent company disclosures for operating evidence before converting app popularity into chip-revenue estimates. Keep any change in the broader macro environment alongside the worksheet so the review does not assign every move to AI.
Sources
- CNBC: AMD's intraday valuation milestone, semiconductor performance, and Monday's index closes, linked above.
- Bloomberg: semiconductor rally and Meta Muse demand context, linked above.
- Reuters: AMD reaches the $1 trillion valuation threshold.
- CNBC: Muse adoption estimates and platform-comparison limitations, linked above.
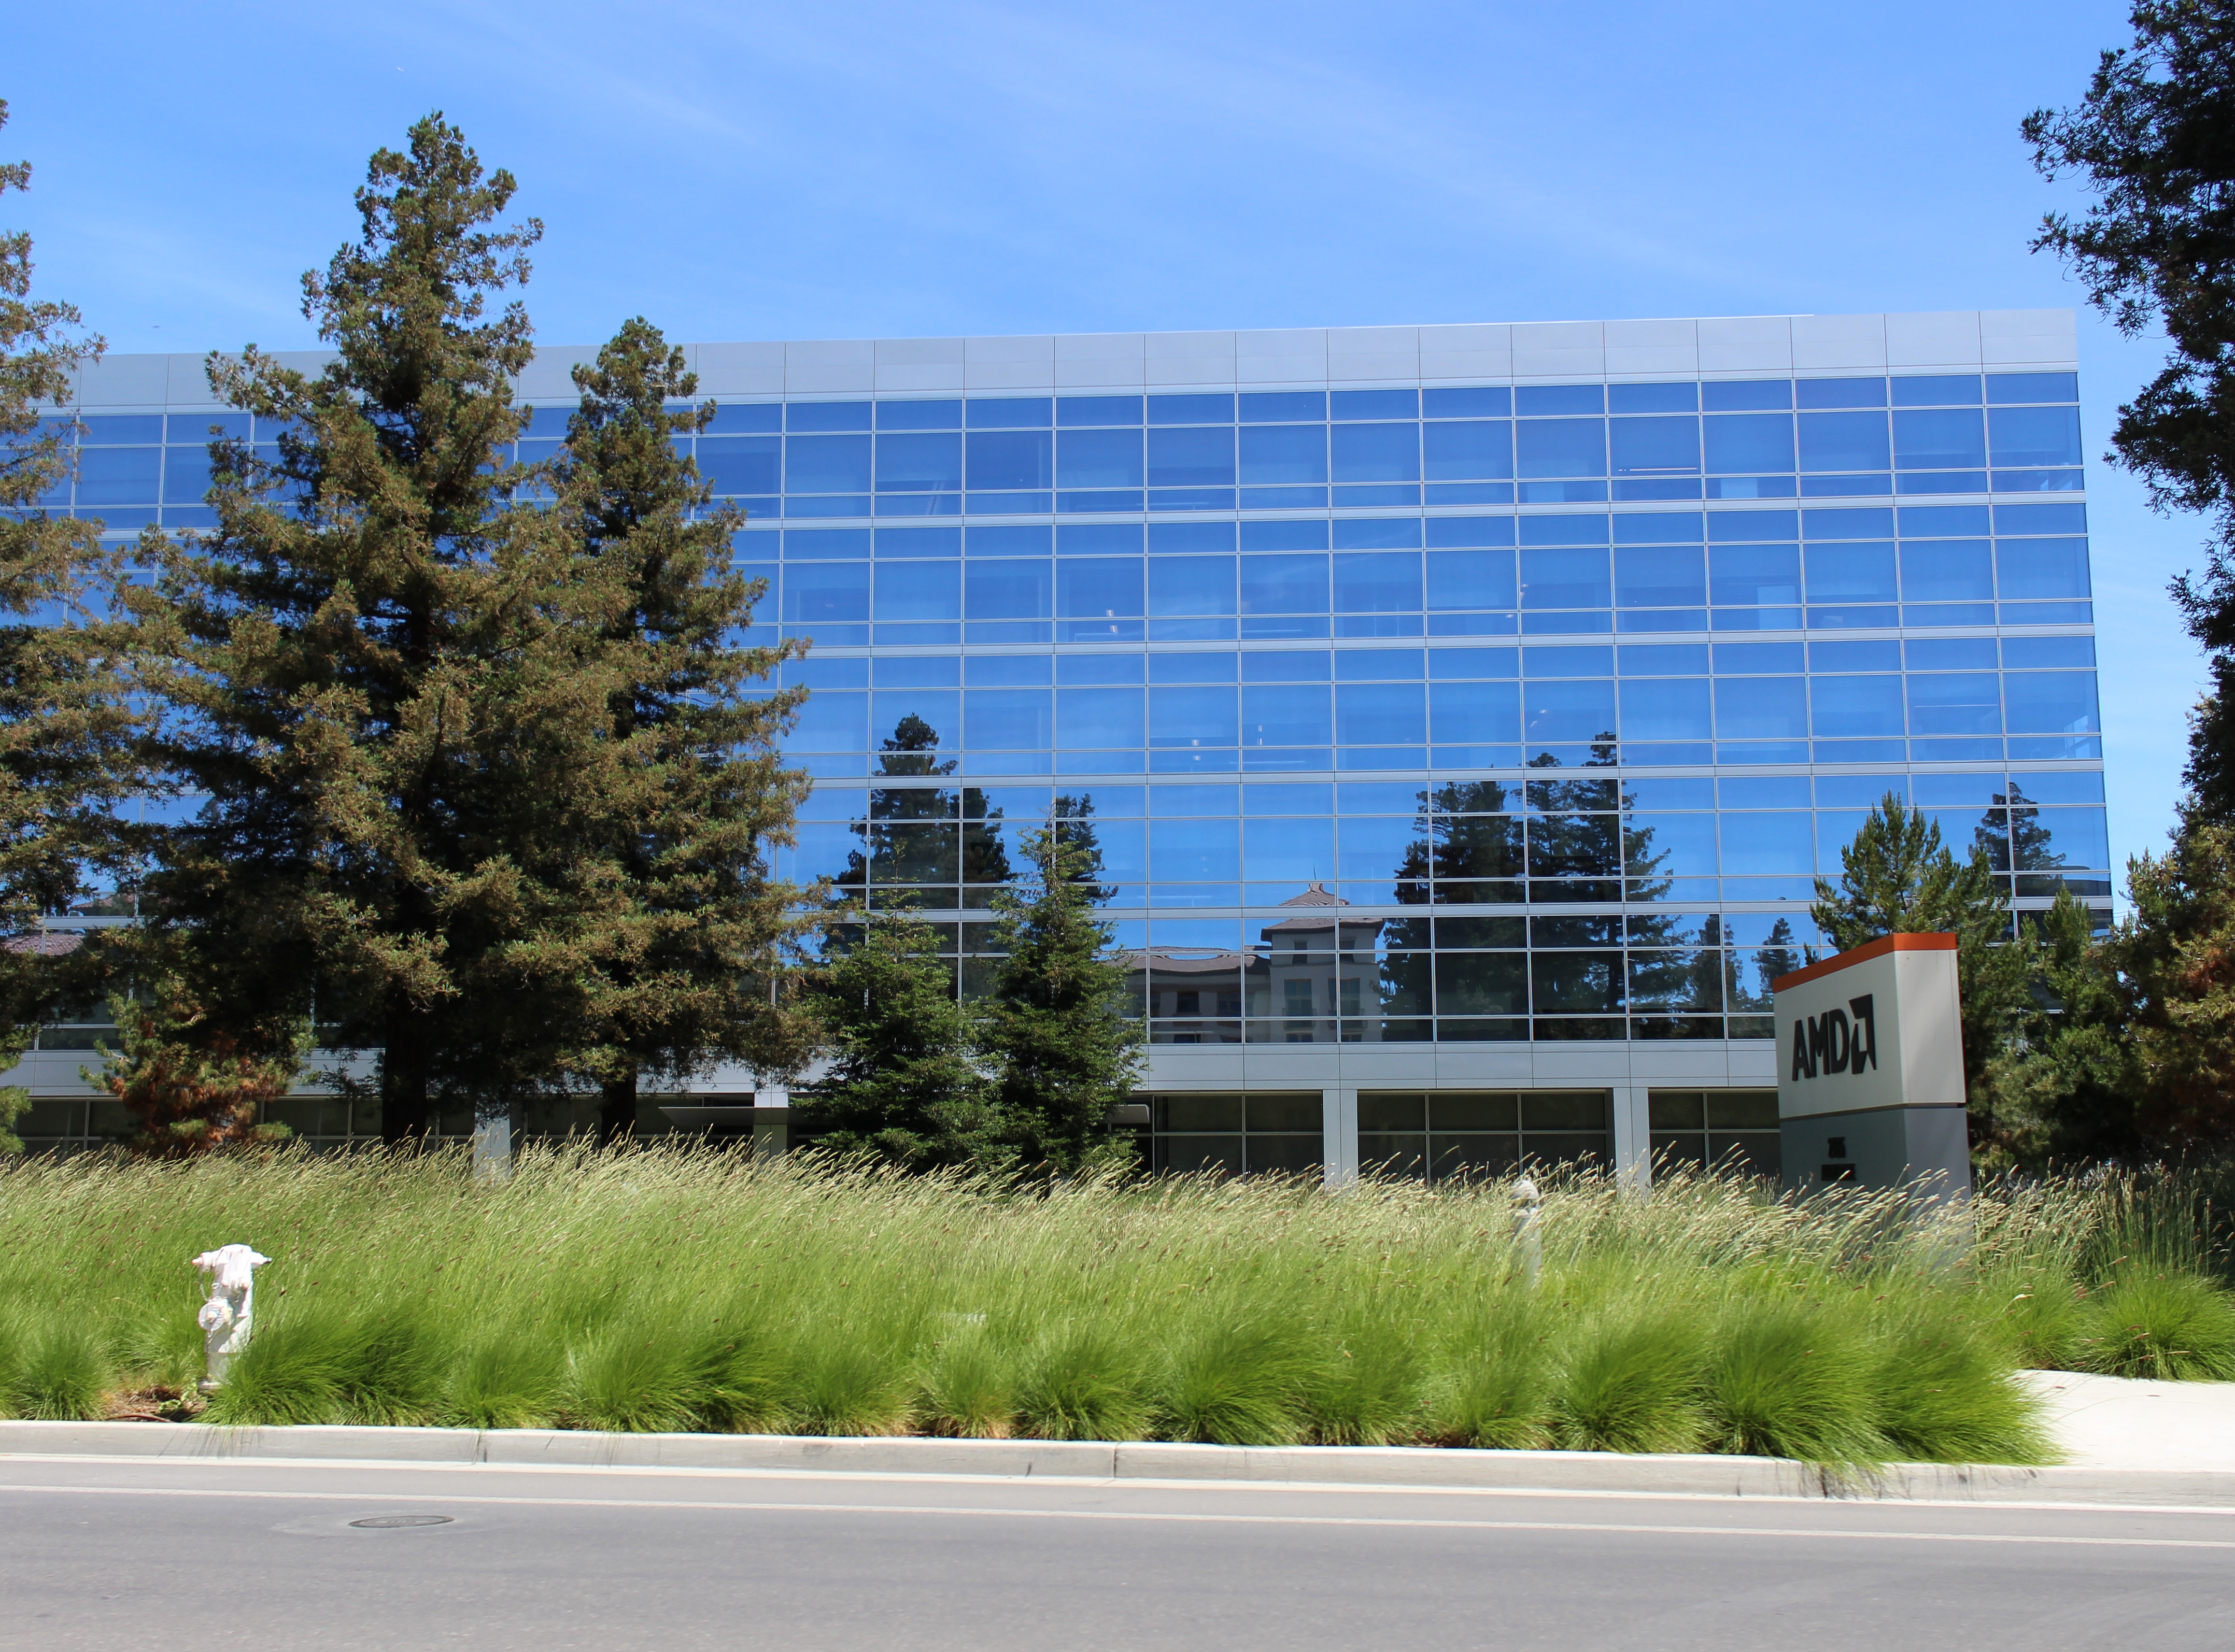
Feature photo: AMD's headquarters at 2485 Augustine Drive, Santa Clara, photographed June 21, 2020. Coolcaesar, Wikimedia Commons, CC BY-SA 4.0. Historical location photo, not an image of today's trading session.

Build real skills, not bad habits. Practice trading decisions with ChartDojo's AI-powered feedback and start your free trial.